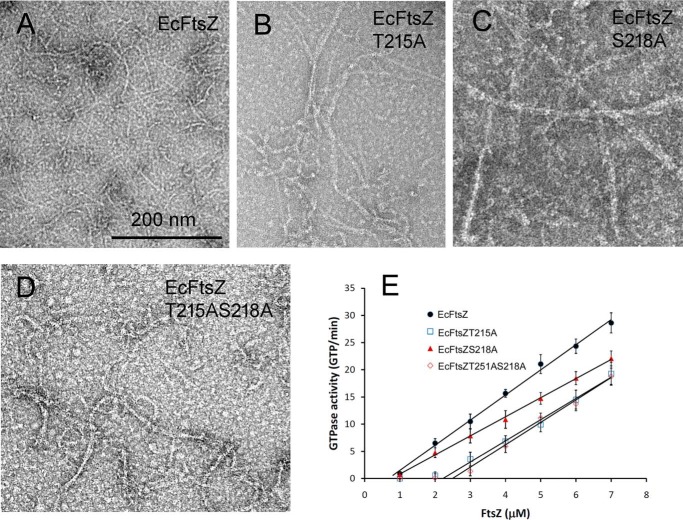
Figure 8.
A–D, assembly of EcFtsZ with Thr-215 and Ser-218 changed to Ala at pH 7. 5, singly or together. All mutants showed a modest increase in pf pairs and thin bundles. Bar, 200 nm. E, GTPase activity showed only small changes for the mutants, although S218A caused a significant increase in the critical concentration. Error bars, S.D.

