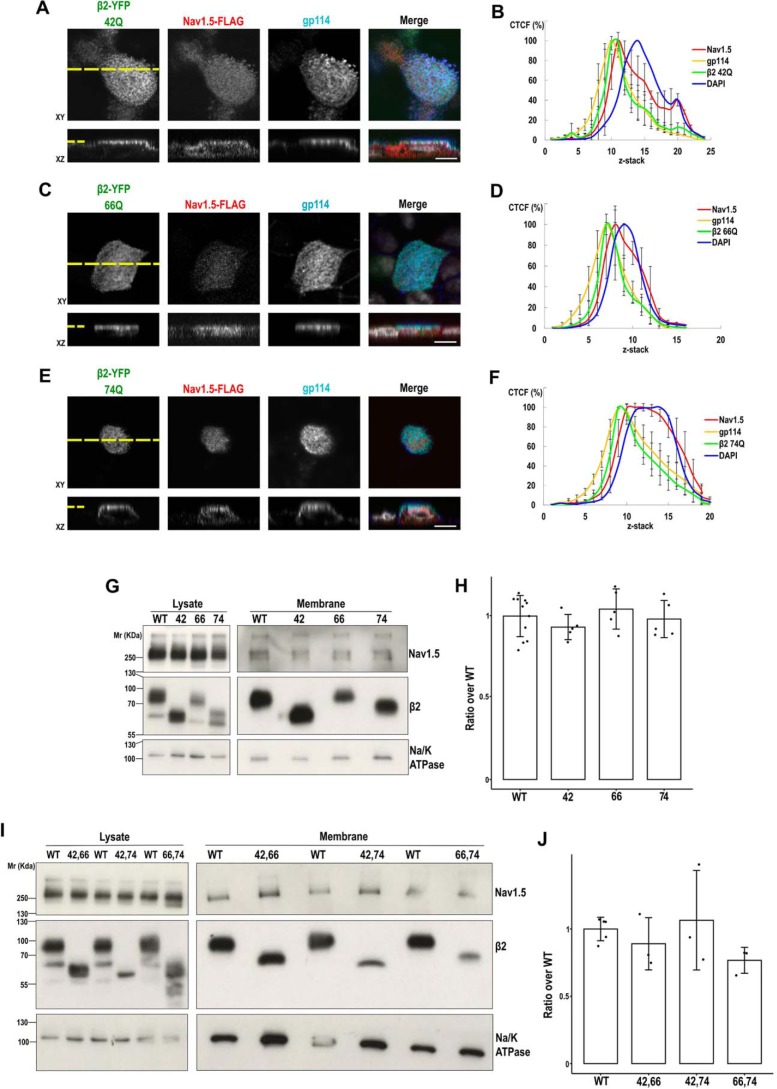
Figure 11.
Single and double glycosylation mutants of β2 can promote surface localization of NaV1.5. MDCK cells (A, C, and E) stably expressing the indicated single mutant for β2-YFP glycosylation were transiently transfected with the vector SCN5A-FLAG and grown polarized in Transwells. Cells were fixed and immunostained with a rabbit polyclonal antibody against NaV1.5 (red), and with a mouse mAb to gp114 (cyan). Images were obtained by confocal microscopy. In merged images, the YFP-emitted fluorescence is in green, and DAPI is in gray. Representative xy sections taken at the apical level (section level chosen to assess presence of NaV1.5 at the apical surface) and corresponding z axis reconstruction (reciprocal xz and xy sections marked by a yellow dashed line) show noticeable apical localization of NaV1.5 with the different β2 variants. Scale bars, 10 μm. B, D, and F, line charts displaying the CTCF (mean percentage ± S.D. (error bars)) along an apical-to-basal z-stack (section 1: most apical; 0.5-μm optical slice thickness) show the NaV1.5 curve peak in close proximity to those of apical gp114 and any of the β2 mutants. DAPI is included as reference for the nuclear level (≥6 cells were analyzed per condition). G and I, MDCK cells stably expressing NaV1.5-YFP were transiently cotransfected with the SCN2B-yfp vector to express β2-YFP, WT, or any of the indicated single (G) or double (I) mutants, plus additional SCN5A-FLAG vector to ensure extensive NaV1.5 overexpression, and grown overnight in wells. Cells were surface-biotinylated at 4 °C. The same amount of protein was used to process each lysate (∼600 μg), 97% of which was subjected to overnight NeutrAvidin pulldown. Representative Western blots (G and I) and band quantitation (H and J) show comparable levels of NaV1.5 in biotin-NeutrAvidin pulldowns (Membrane) in the presence of any mutant variant of β2 as with the WT. One-way ANOVA revealed no differences among means. Data are mean ± S.D. (n ≥ 3). Na/K-ATPase was blotted as surface marker to correct for quantitations in pulldowns. Molecular mass markers are in kDa. For clear display, the blots in G and I show lysates and pulldowns separated by division lines, which indicate different exposure between each.

