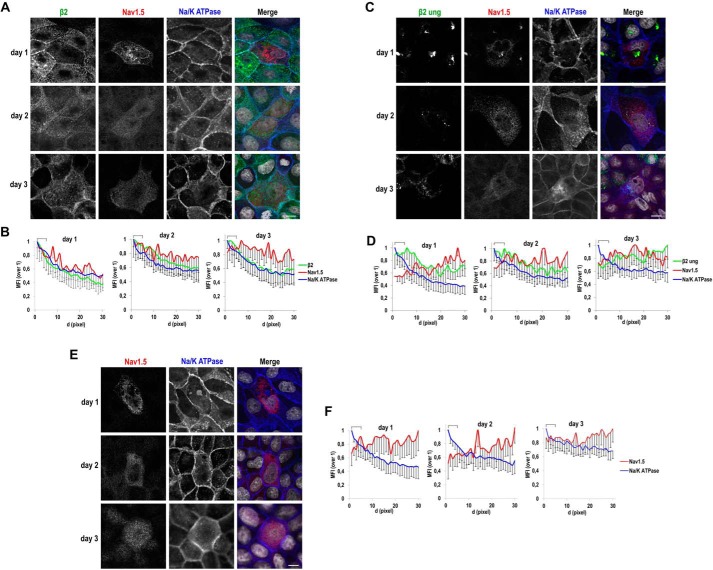
Figure 9.
Defect over time of unglycosylated β2 in promoting surface localization of NaV1.5. MDCK cells stably expressing WT (A) or fully unglycosylated (ung) β2-YFP (C) or untransfected (parental) cells (E) were transiently transfected with the vector SCN5A-FLAG and grown in wells for the indicated number of days. Cells were fixed and immunostained with a rabbit polyclonal antibody against NaV1.5 (red) and with a mouse mAb to Na/K-ATPase (blue). Images were obtained by confocal microscopy. In merged images, the YFP-emitted fluorescence is shown in green and DAPI is in gray. A, C, and E, representative xy sections (sections taken at the cell level where NaV1.5 is mainly found in each case) show a general diffuse NaV1.5 pattern, intracellular and often perinuclear, except for a noticeable overlap with Na/K-ATPase, particularly at day 1, in the presence of β2 WT. Scale bars, 10 μm. Confocal images were analyzed by calculating the MFI along linear segments of 30 pixels in length (d, distance; 0.1 μm/pixel) drawn from the cell end perpendicularly into the cytoplasm. B, D, and F, line charts show MFIs with the first 5 pixels of the segments, equivalent to the plasma membrane region (cell end), marked with a square bracket. The highest MFI levels are at the cell end for Na/K-ATPase and for β2 WT, which progressively decrease intracellularly. The profile for NaV1.5 increases at the cell end only in the presence of β2 WT and especially at day 1 (B) but remains comparatively low within this region with unglycosylated β2 (D) or in the absence of β2 (F). Data are mean ± S.D. (error bars) (number of cells analyzed ≥3; 4 segments/cell).

