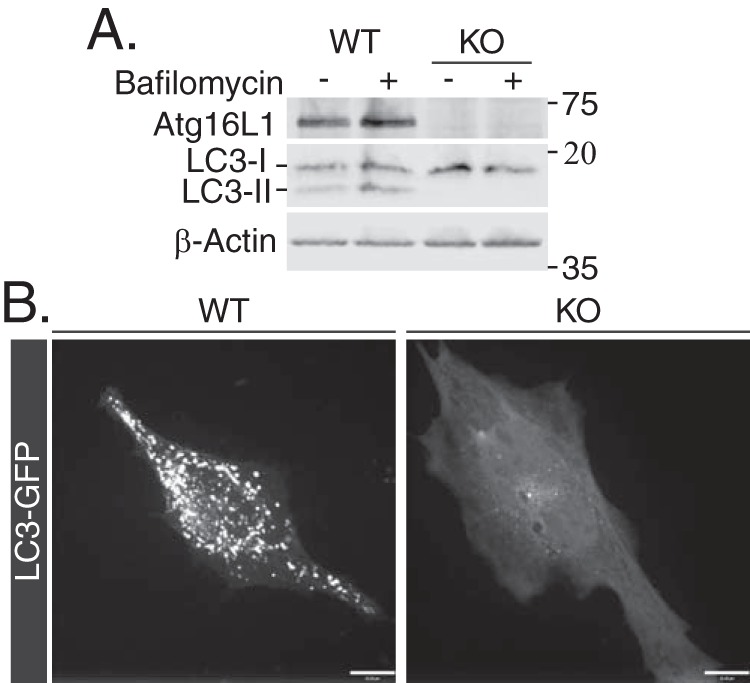
Figure 1.

WT and ATG16L1 KO MEFs characterization. A, WT and ATG16L1 KO MEFs were treated with 500 nm bafilomycin for 4 h and immunoblotted for ATG16L1, LC3-I, and LC3-II to evaluate ATG16L1 KO and autophagic flux. B, MEFs were transfected with LC3-GFP (24 h) and live cell imaging was performed to evaluate autophagosome formation, seen as puncta. Scale bars: 10 μm.
