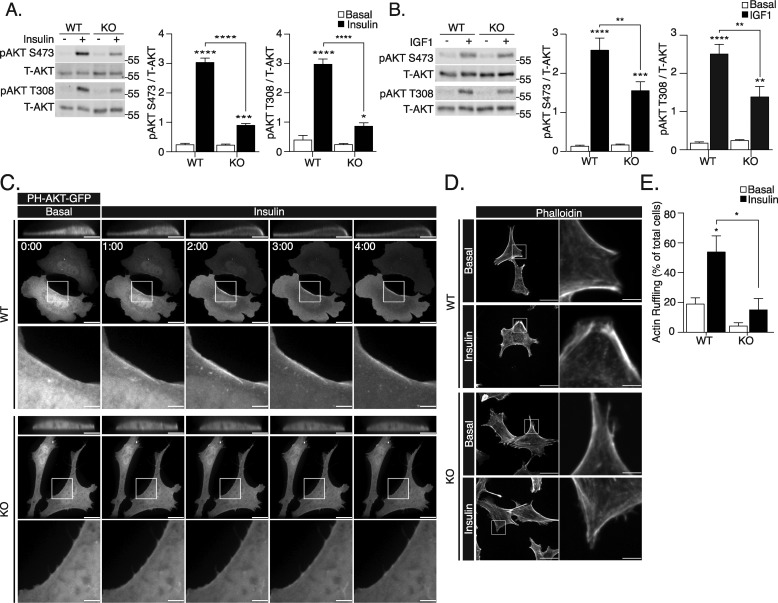
Figure 2.
Insulin and IGF1 signaling is attenuated in ATG16L1 KO MEFs. Cell lysates were collected for immunoblotting of pAKT Ser-473 and Thr-308 residues from WT and ATG16L1 KO MEFs following treatment with (A) insulin (10 nm, 10 min, n = 4) or (B) IGF1 (100 ng/ml, 10 min, n = 5). Total AKT was also immunoblotted in each experiment and the pAKT/total AKT densities were calculated using Image Studio 5.2.5 software and compared with untreated (basal) cells. C, WT and ATG16L1 KO MEFs on coverslips were transfected with PH-Akt-GFP for 24 h. During experimentation, live cell imaging was performed for 4 min. 100 nm insulin was added to the media immediately following acquisition of the 0:00 time point (scale bars: 15 μm). Insets corresponding to the area within the box (scale bars: 3.75 μm), as well as the XZ plane cropped to display the same cell (scale bars: 7.5 μm), are shown. D, WT and ATG16L1 KO MEFs were treated with 100 nm insulin for 10 min, fixed, and stained with phalloidin-565 to examine insulin-stimulated cortical actin ruffling, observed as regions of enriched phalloidin labeling (scale bars: 30 μm). Insets of membrane actin organization are shown (scale bars: 5 μm). E, quantification of percentage of cells displaying actin remodeling (n = 3, with >20 cells examined per group in each independent experiment). For all measures, p value was calculated using a two-way ANOVA with Tukey's post hoc. *, p < 0.05; **, p < 0.01; ***, p < 0.001; ****, p < 0.0001.

