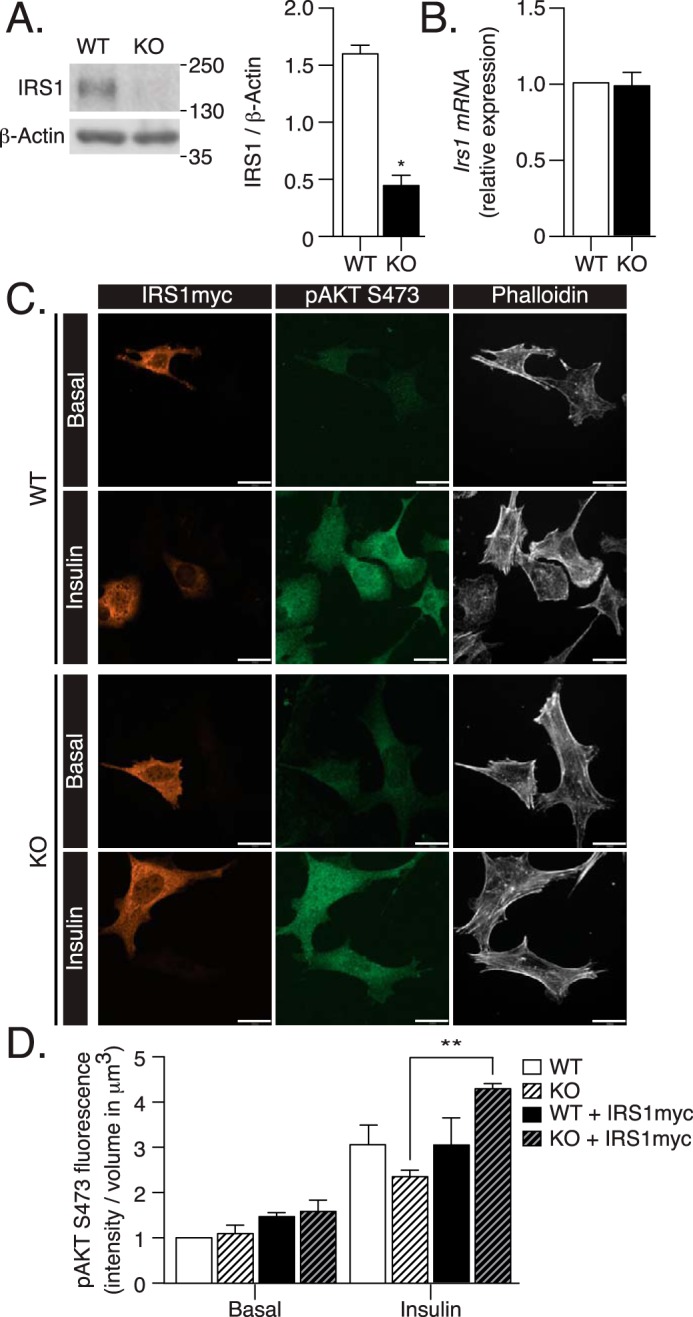
Figure 4.

Defects in insulin signaling induced in ATG16L1 KO MEFs are mediated by decreased IRS1 expression. A, IRS1 protein content, and B, mRNA expression were analyzed by immunoblotting or qPCR in WT and ATG16L1 KO MEFs (n = 3). p value was calculated using a two-tailed paired t test. C, WT and ATG16L1 KO MEFs on coverslips were transfected with Irs1myc for 24 h, then treated with insulin (100 nm, 10 min), followed by fixation and immunostaining for myc, pAKT Ser-473, and with phalloidin 670. IRS1myc overexpressing cells were compared with non-overexpressing cells, identified by the presence of phalloidin 670 and lack of IRS1myc (n = 3). Scale bars: 25 μm. D, pAKT Ser-473 fluorescence was quantified as fluorescent intensity relative to cell volume using Velocity 6.3 software. Absolute values of insulin-stimulated pAKT Ser-473 intensity/μm2 (a.u.) for the representative images are as follows: WT, 35153.44; WT-IRS1myc, 40493.62; KO, 30533.00; and KO-IRS1myc. 56836.04. p value was calculated using a two-way ANOVA with Tukey's post hoc. *, p < 0.05; **, p < 0.01.
