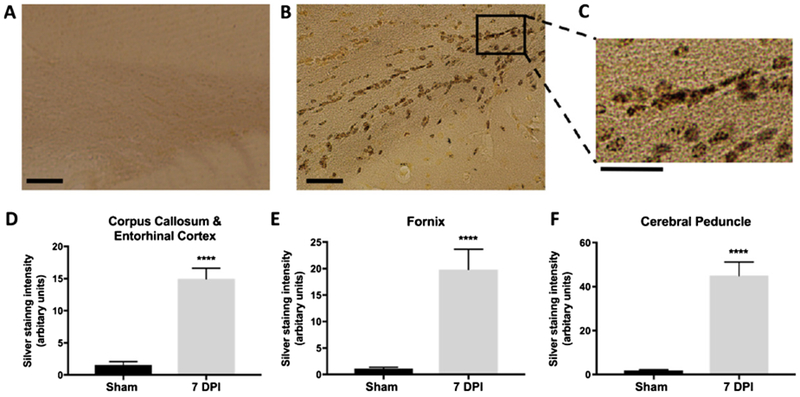
Fig. 3.

Axonal injury detected and quantified after LIB exposure by silver staining. A) Representative images from the sham group showed no axonal injury (scale bar = 50 μm). B, C) Representative images from the blast group showed axonal injury at corpus callosum and entorhinal cortex (scale bar = 50 μm). Inset box represent the higher magnification of the indicated area (scale bar = 25 μm). D-F) Intensity of silver staining in corpus callosum and entorhinal cortex, fornix, and cerebral peduncle regions in blast group at 7 DPI were significantly higher than that in the sham group. All comparisons were performed between blast and sham groups with t-test; n = 5 for sham controls, and n = 4 for blast at 7 DPI. Differences were considered significant at p < 0.05 for all analyses, with asterisks representing p < 0.0001.
