
Fig. 8.
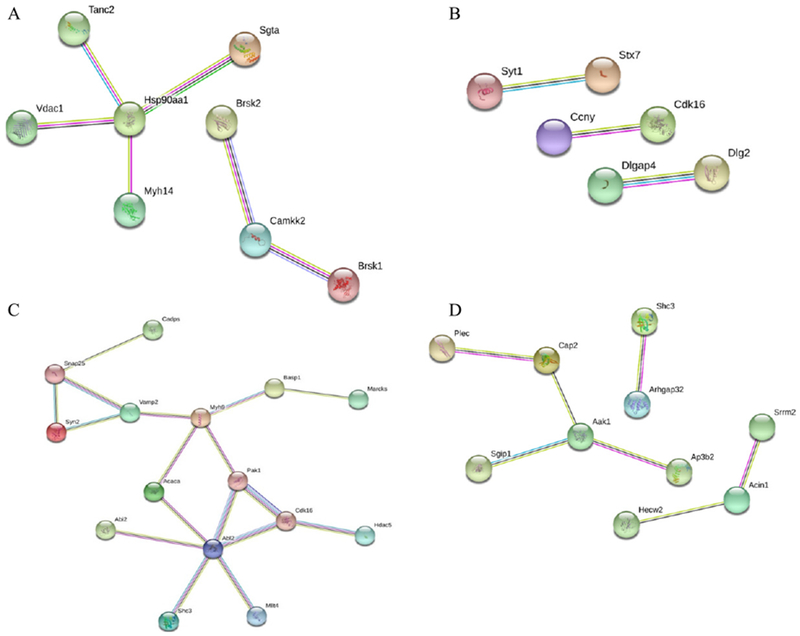
Network analysis of all captured phosphoproteins was illustrated using the web-based tool STRING. Proteins from mouse brains at 3 h (A), 24 h (B), 30 days (C), and 15 weeks (D) after the blast were compared to those from the control group using LC-MS/MS, and the enriched cellular components and altered proteins were analyzed by DAVID.