
Fig. 3.
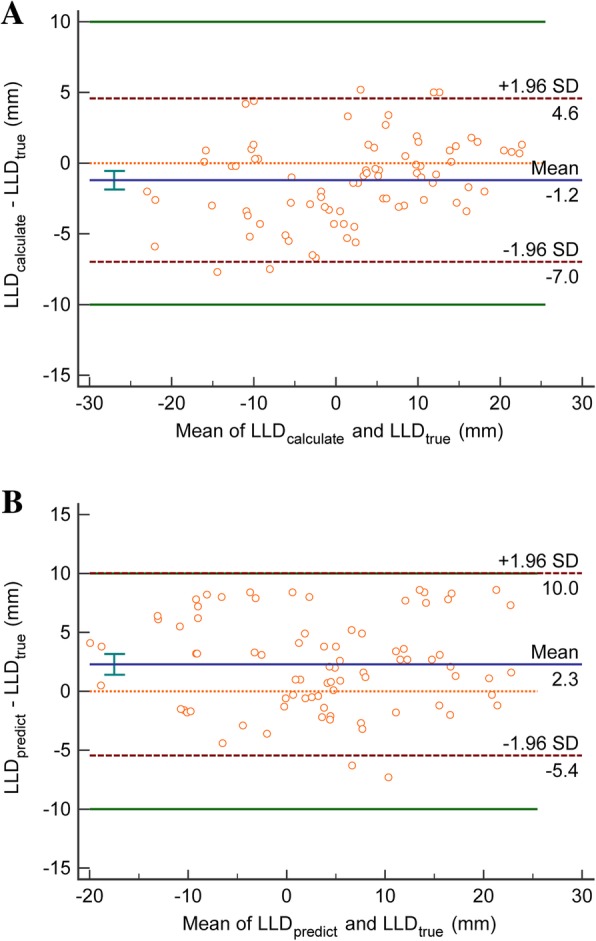
Bland-Altman plots for the disparity between the LLDcalculate and LLDtrue (a), and between LLDpredict and LLDtrue (b) measured by different ways. The mean bias is shown as a solid blue line; the dashed dark red lines represent the 95% limits, the green lines represent the maximum allowed clinical difference. SD = standard deviation