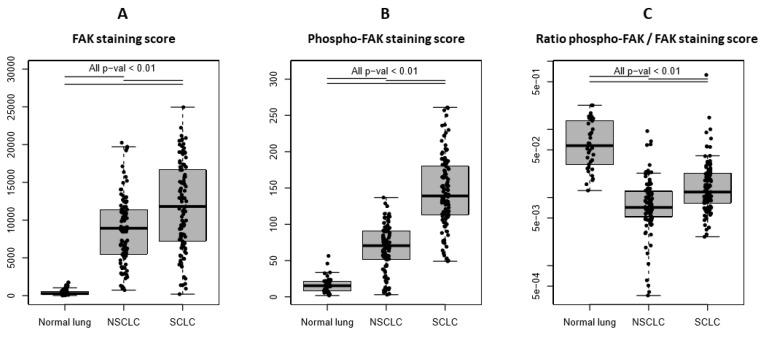
Figure 3.
Quantification of FAK and phospho-FAK (Y397) expression evaluated by multiplex immunofluorescence immunohistochemistry in 37 normal lungs, 95 non-small-cell lung cancer (NSCLC), and 105 small-cell lung cancer (SCLC) tissues: (A) FAK staining score: Percentage (%) of FAK-stained tumor area multiplied by (x) FAK mean intensity, (B) phospho-FAK (Y397) staining score: (% of phospho-FAK-stained tumor area of low intensity × 1) + (% of phospho-FAK-stained tumor area of medium intensity × 2) + (% of phospho-FAK-stained tumor area of high intensity × 3), and (C) ratio between phospho-FAK and FAK staining scores. Each dot represents one sample. Data presented as the mean ± S.D. p-values were obtained using linear models and adjusted for multiple testing using the Bonferroni method.

