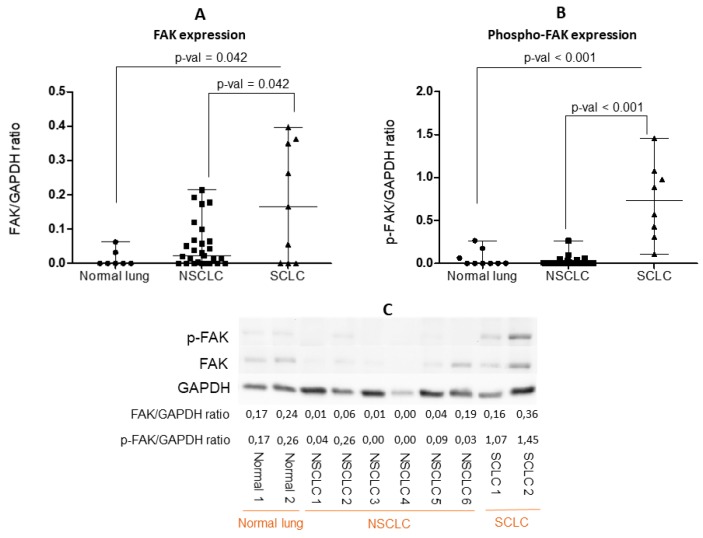
Figure 5.
Quantification of (A) FAK and (B) phospho-FAK expression evaluated by Western blot (WB), with normalization to glyceraldehyde 3-phosphate dehydrogenase (GAPDH ) expression, in nine normal lungs, 30 non-small-cell lung cancer (NSCLC), and 10 small-cell lung cancer (SCLC) tissue lysates. Each dot represents one sample. Data presented as the mean ± S.D. Significance determined by the Kruskal-Wallis test. (C) Illustration of a representative WB of FAK and phospho-FAK (Y397) expression in normal lung, NSCLC, and SCLC tissue lysates. All the WB are represented in Supplementary Figure S1.

