Figure 6.
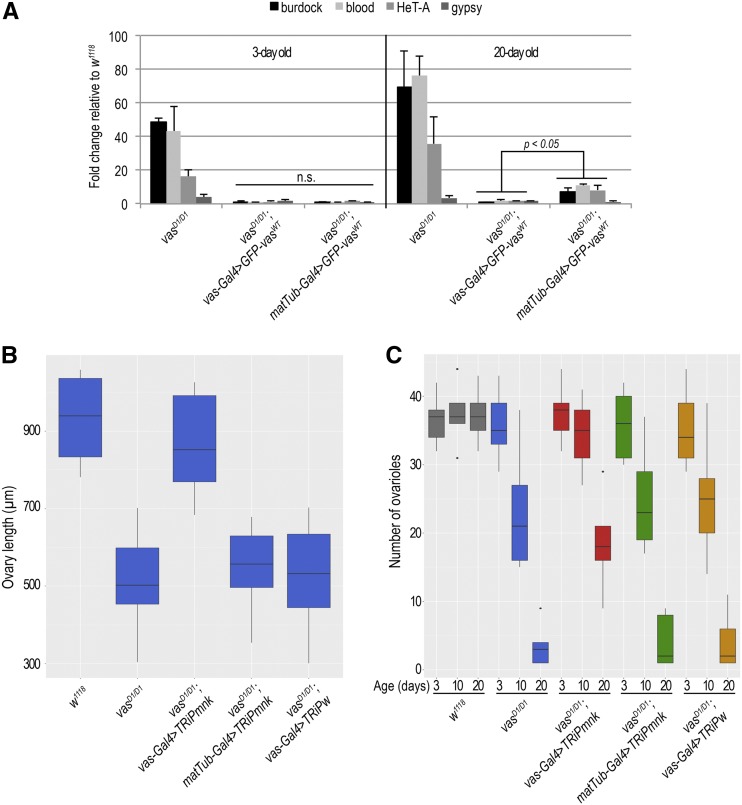
Chk2 signaling in the germarium induces arrest of germ cell development. (A) Quantitative PCR analysis for LTR transposons burdock, blood, and gypsy and non-LTR transposon HeT-A in 3- and 20-day-old vasD1/D1; vas-Gal4 > GFP-VasWT and vasD1/D1; matTub-Gal4 > GFP-VasWT flies. Expression of transposons in wild-type (w1118) was set to 1 and normalized to rp49 mRNA in individual experiments. Error bars represent SD from two biological replicates. P-values were determined by Student’s t-test. (B) Box plot representing length of ovaries of wild-type (w1118), vasD1/D1, vasD1/D1; vas-Gal4 > TRiPmnk, vasD1/D1; matTub-Gal4 > TRiPmnk, and vasD1/D1; vas-Gal4 > TRiPw flies. The measurements were performed on 15 flies (n = 15). (C) Box plot representing the number of egg chamber–producing ovarioles per 3-, 10-, and 20-day-old wild-type (w1118), vasD1/D1, vasD1/D1; vas-Gal4 > TRiPmnk, vasD1/D1; matTub-Gal4 > TRiPmnk, and vasD1/D1; vas-Gal4 > TRiPw females. Experiment was performed on five flies (n = 5). Dots in the box plot represent values that are 1.5 times greater than the upper limit or 1.5 time smaller than the lower limit of the interquartile range.

