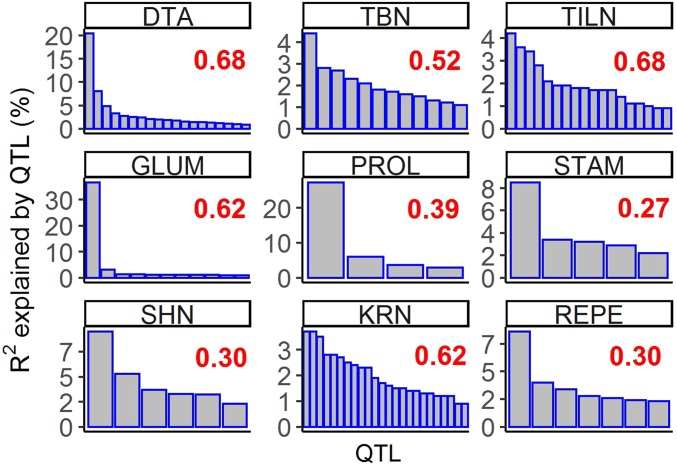
Figure 2.
Distinct genetic architectures for different traits. The nine traits that we focused on in the main text are shown. The x-axes indicate QTL and the y-axes indicate the phenotypic variation explained by each QTL (R2). Red numbers indicate variance explained by the QTL model for each trait. The R2 distribution for 13 additional traits can be found in Figure S28. DTA, days to anthesis; GLUM, glume score; KRN, kernel row number; PROL, prolificacy; REPE, red pericarp; SHN, shattering; STAM, staminate spikelet; TBN, tassel branch number; TILN, tiller number.

