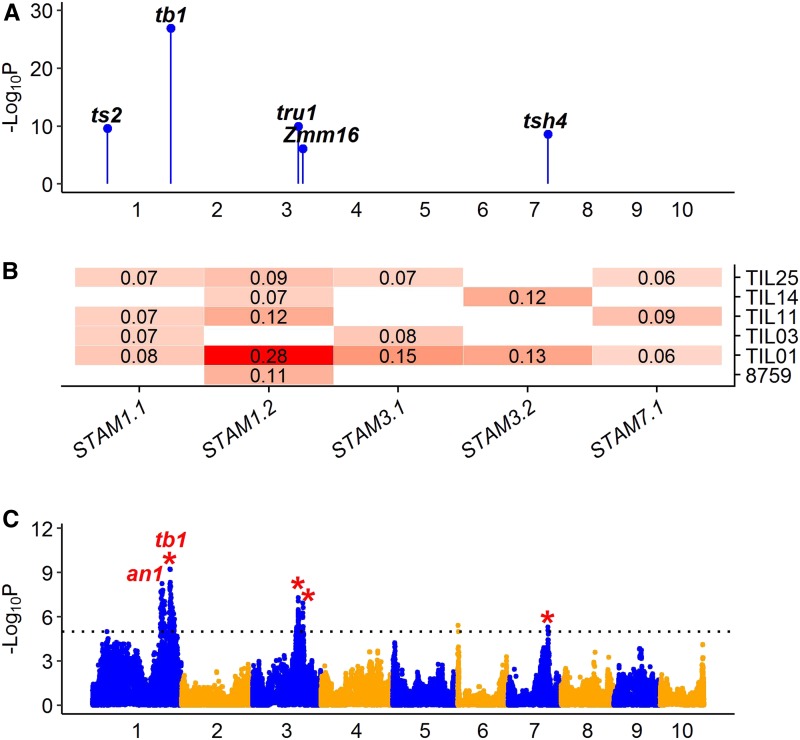
Figure 4.
QTL characterization for domestication trait STAM. (A) Genomic distribution of five QTL for STAM detected by JLM. The known candidate genes are shown above the corresponding QTL in bold italic. (B) Heat map shows additive allele effects of teosinte relative to maize for five QTL detected by JLM. The allele effect of teosinte parent 8759 was estimated from the 866 maize–teosinte BC2S3 RILs (Shannon 2012). Insignificant effects are shown as blank. The teosinte genotypes at all QTL consistently contribute to a staminate lateral inflorescence. (C) Manhattan plot shows QTL detected by GWAS. The significance threshold at LOD = 5 is indicated by black dotted line. The red stars indicate GWAS signals overlapping with QTL by JLM. In (A) and (C), odd and even numbered chromosomes are shown in blue and orange colors, respectively. GWAS, genome-wide association study; JLM, joint linkage mapping; RIL, recombinant inbred line; STAM, staminate spikelet.

