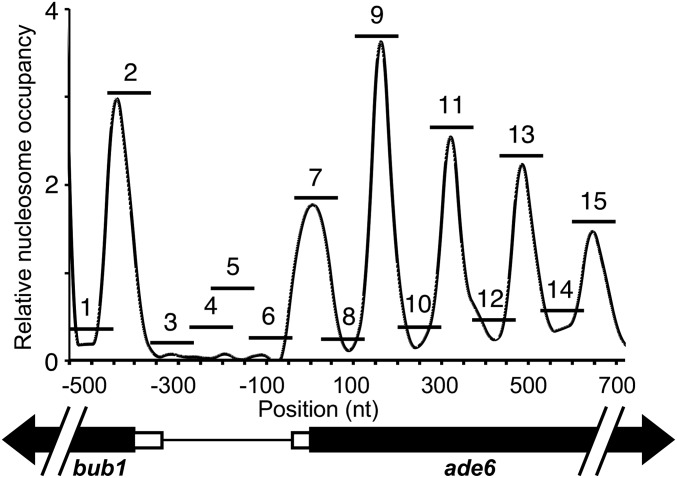
Figure 2.
Nucleosome occupancy at ade6 and design of PCR amplicons used to map chromatin structure. Graph displays our plot of published data on nucleosome occupancy in a pat1-114 strain background (like that used in our study) prior to entering meiosis (Soriano et al. 2013). A diagram of the 1.2 kb region of interest is below, indicating the 5′ UTRs (open boxes) and coding regions (black arrows) of the bub1 and ade6 genes. Relative nucleosome occupancy (GEO study GSE41773, sample GSM1024000, from single-end sequencing of DNA molecules after MNase digestion of chromatin) was plotted with the A of the ade6 start codon designated as nucleotide (nt) position +1. The horizontal bars numbered 1 through 15 indicate the positions of the overlapping PCR amplicons designed for, and used in, this study. See Table S3 for the DNA sequences and coordinates of the PCR primer pairs.

