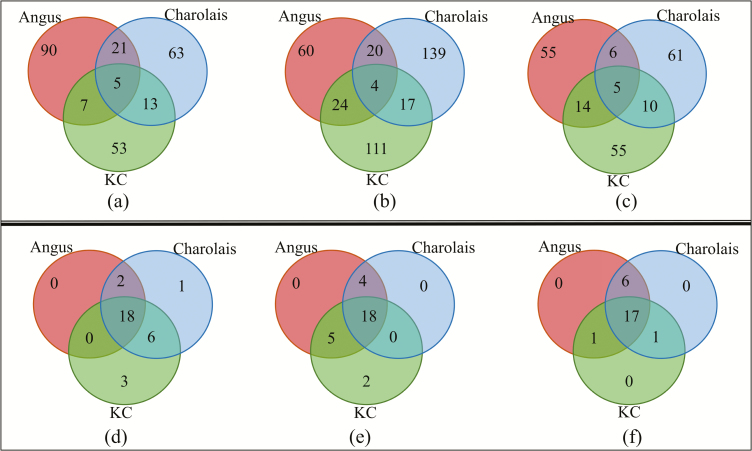
Figure 1.
Venn diagrams showing differentially expressed genes overlap among Angus, Charolais, and Kinsella Composite (KC) for (a) average daily gain (ADG), (b) daily dry matter intake (DMI), and (c) metabolic body weight (MWT). Venn diagrams showing significant enriched biological functions overlap among breeds for (d) ADG, (e) DMI, and (f) MWT.

