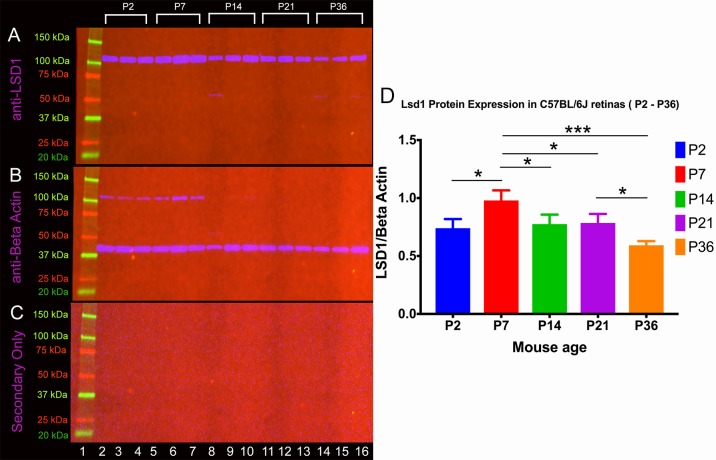
Figure 1.
LSD1 protein levels peaks at P7. Western blot analysis was conducted on C57BL/6J mouse retina samples at five different time points (P2, P7, P14, P21, and P36) in triplicate. Samples were probed with an anti-LSD1 antibody (single band, expected size, 107 kDa) (A), anti-beta-actin (single band, expected size, 43 kDa) served as a loading control (B), and secondary-only controls detected no nonspecific antibody binding (C). (D) Quantification of results was achieved using densitometry, and LSD1 levels were normalized to beta-actin. A two-way ANOVA with Tukey's multiple comparison test was conducted between the mean expression level in all possible pair combinations. There is a statistically significant decrease in LSD1 protein levels between P2 and P7, P7 and P14, P7 and P21, P7 and P36, and P21 and P36. A full list of comparisons and P values is listed in Supplementary Table S1. *P < 0.05, **P < 0.01, ***P < 0.001.

