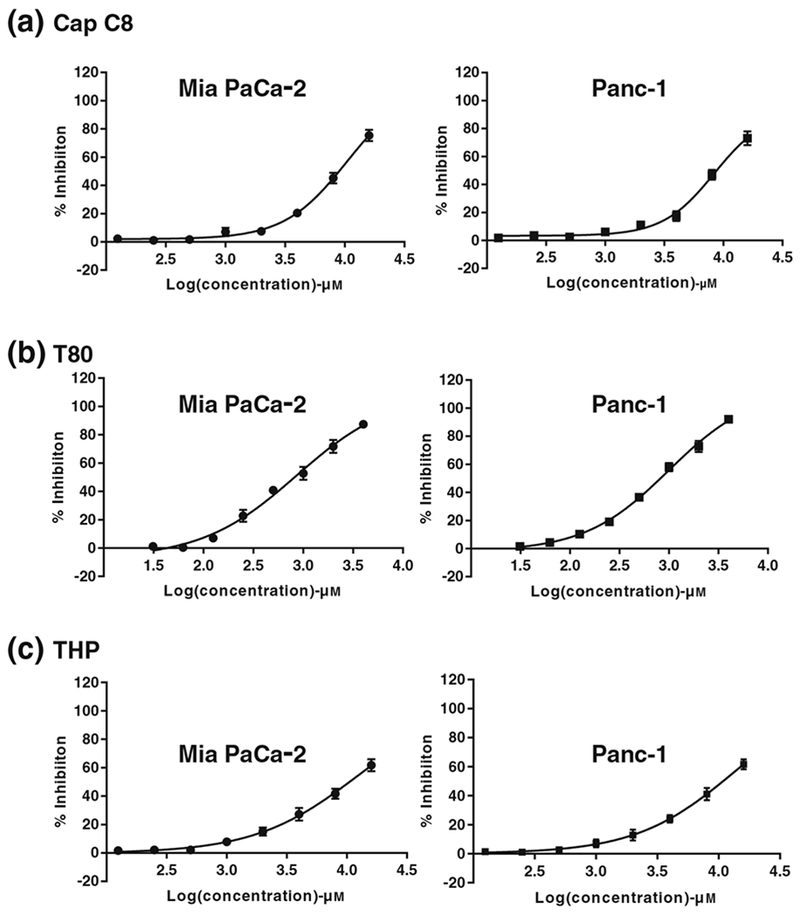
Fig. 3.

Dose-dependent cell inhibition study in human PC cell line MIA PaCa-2 and Panc-1 using MTS assay upon treatment with a Cap C8, b T80, and c THP. MTS assay was executed to determine the cell inhibition after treatment with various treatment groups over a wide concentration range. Graphpad Prism 7 software was used to analyze the data using non-linear regression analysis. The experiment was performed in triplicates (n = 3) and data is represented as mean inhibition in triplicate independent and parallel experiment
