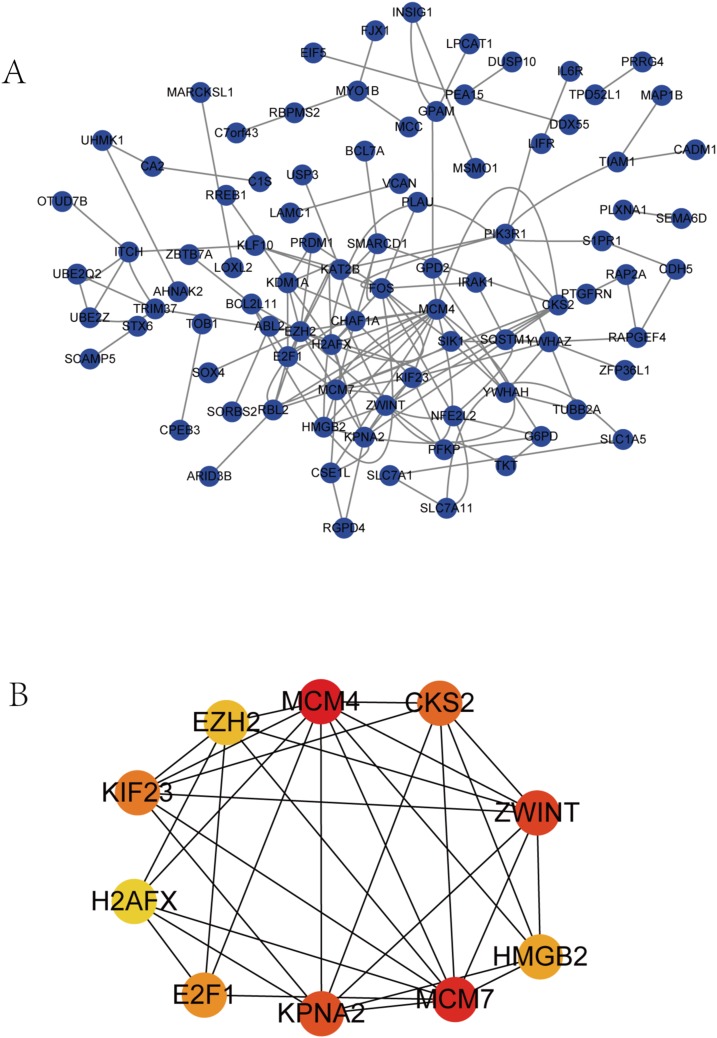
Figure 4. PPI network of DEGs and hub genes.
(A) PPI network of DEGs. Blue nodes represent the interaction among DEGs. Only the 90 DEGs that interacting with other ones were demonstrated in the network. (B) A total of 10 Hub genes identified from the PPI network. From the red nodes to yellow ones, the connection degree of each molecule with others gradually decreases.

