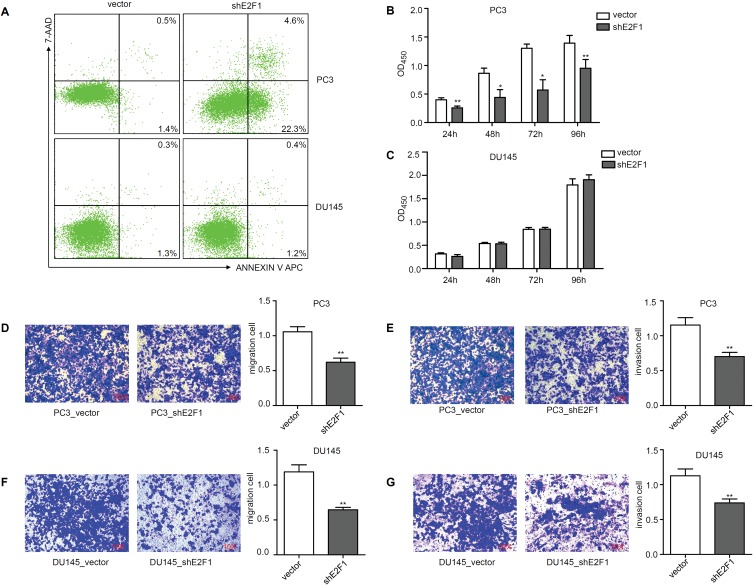
Figure 2.
Cellular experiments for PC3 and DU145 after knockdown of E2F1.
Notes: Apoptosis level of PC3 and DU145 groups (A). Proliferation level of PC3 (B) and DU145 (C). PC3 cell migration (D) and invasion (E) and DU145 cell migration (F) and invasion (G) were detected. Statistical significance was calculated using an independent-samples t-test; *P<0.05, **P<0.01.

