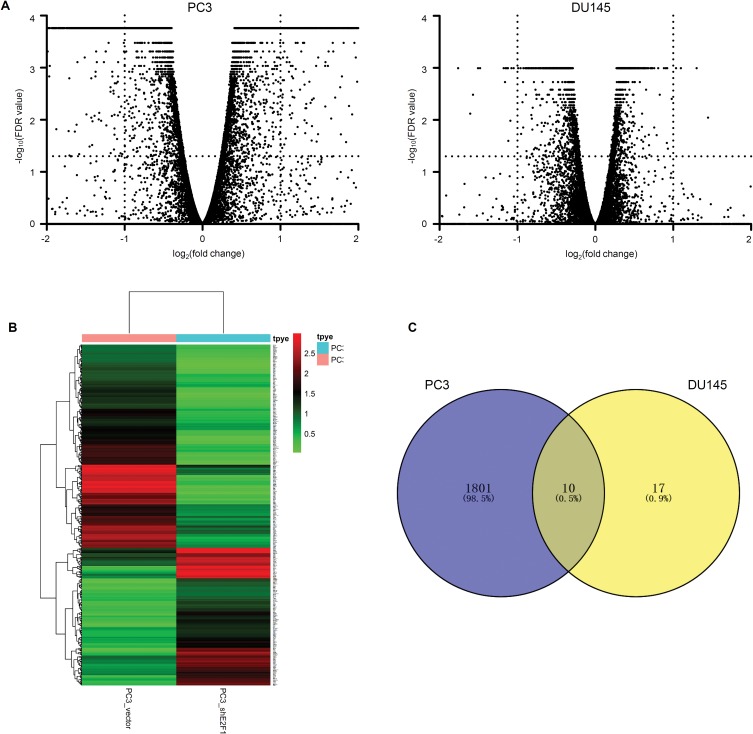
Figure 4.
Comparison of DEGs between vector cells and shE2F1 cells.
Notes: The volcano plot shows all the DEGs compared with vector cells of the PC3 and DU145 groups (A). The heatmap displays expression patterns of DEGs of the PC3 groups (B). Venn analysis of the overlapping DEGs of PC3 and DU145 with depletion of E2F1 (C).

