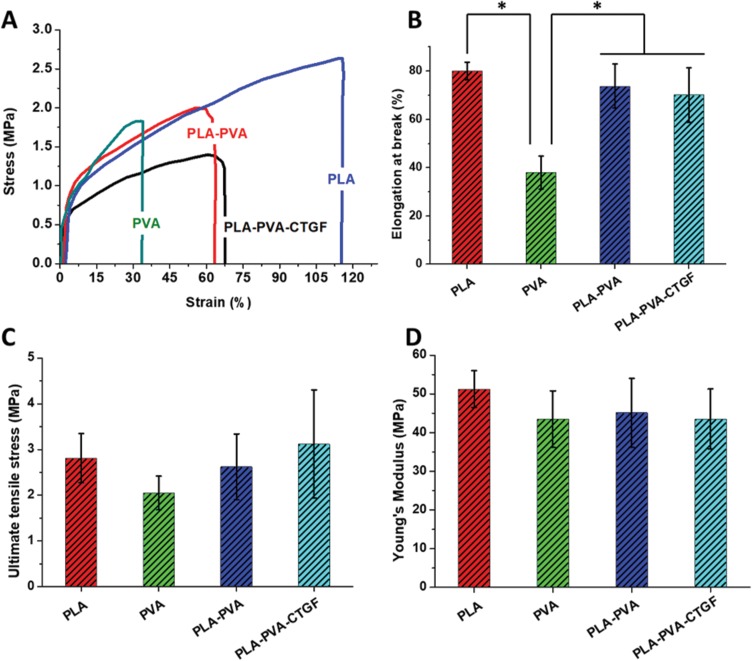
Figure 2.
Mechanical testing results of the developed membranes. Stress-strain curve (A), Elongation at break (B), Ultimate tensile stress (C) and Young’s modulus (D) of PLA, PVA, PLA-PVA and PLA-PVA-CTGF membranes. P-values were calculated using Student’s t-test where (*) indicates a significant difference from other group of comparison (p ≤ 0.05).

