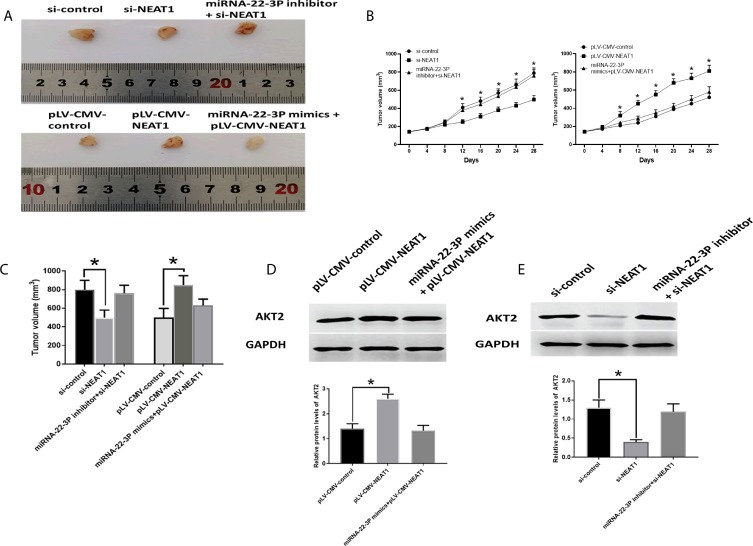
Figure 9.
Roles of NEAT2/miRNA-22-3p/AKT2 axis in vivo study. (A) Representative images of isolated tumors. (B) Tumor growth curve. (C) Tumor volume. (D) Protein expression of AKT2 in HCC tissues of xenograft mice model treated with pLV-CMV-NEAT1, and combination of pLV-CMV-NEAT1 and miRNA-22-3p mimics. (E) Protein expression of AKT2 in HCC tissues of xenograft mice model treated with si-NEAT1, and combination of NEAT1 and miRNA-22-3p inhibitor. Values are means ±SD. (*) denotes the difference between groups (P<0.05).

