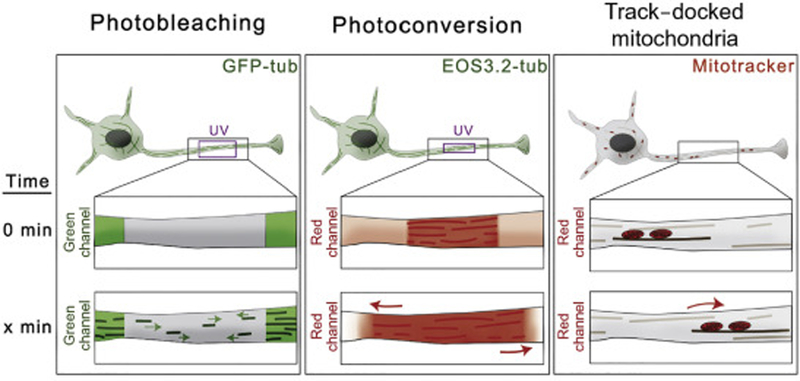
Figure I for Text Box 1. Strategies for imaging and quantify microtubule transport and dynamics in neurons.

Left Panel. Neurons expressing GFP-tubulin. Photobleaching of a small region in the axons allows to visualize movement of non-bleached microtubules through the photobleached region.
Middle Panel. Neurons expressing tubulin fused to a photoconvertible protein EOS3.2 display microtubules in green. Photoconversion of a small region of EOS-labeled microtubules with UV light creates red marks on microtubules. Photoconverted microtubules can be easily tracked and quantified in the red channel.
Right Panel. Neurons are labeled with a mitochondria-specific dye. Movement of microtubules can be tracked indirectly by observing the position of mitochondria docked on microtubules.
