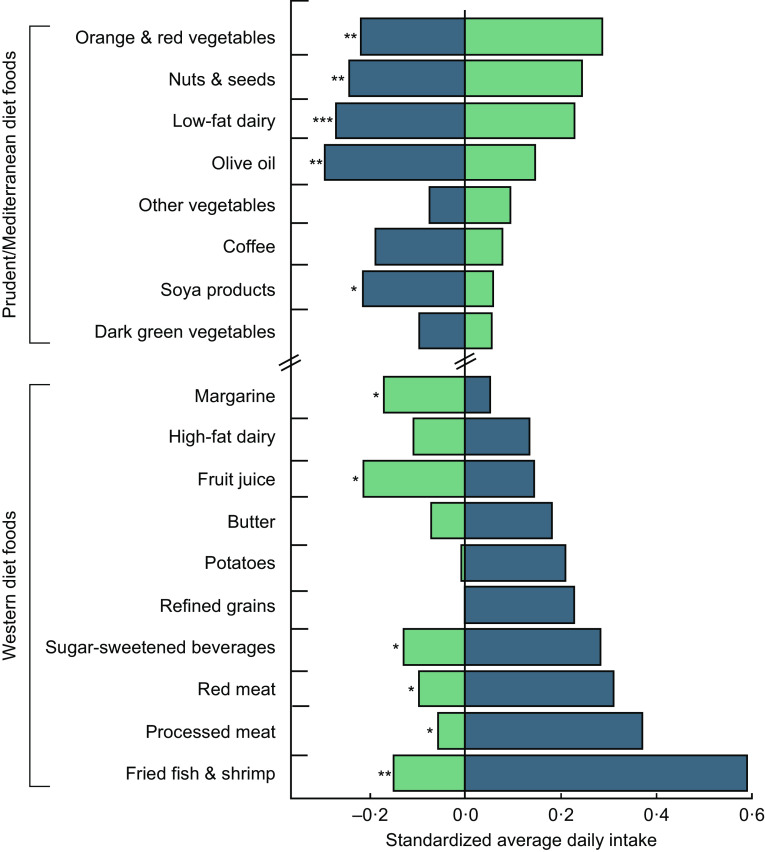
Fig. 4.
The difference in standardized food intake between the poor ( ) and good (
 ) nutrition literacy groups of adults with at least one of four diet-related diseases, metropolitan Kansas City, USA, January 2015–July 2016. Values are group mean intake Z-scores. The plot contains eighteen of the thirty-five food groups utilized in the derivation of the dietary patterns. These eighteen food groups were selected for presentation due to their unique contribution to either the Western pattern or the prudent/Mediterranean pattern and large difference in intake between the poor and good nutrition literacy groups. Intake of these particular food groups explains the observed relative difference in dietary pattern adherence among nutrition literacy groups. *P < 0·05, **P < 0·01, ***P < 0·001

