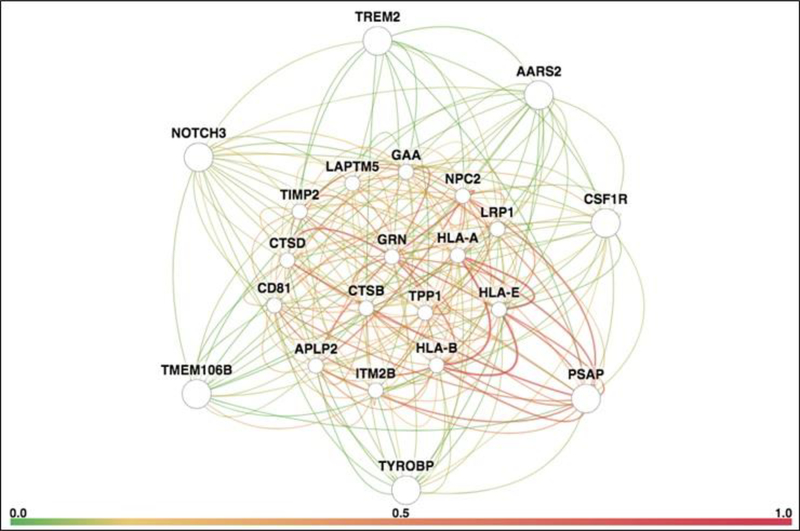
Figure 2. Gene interaction network for leukodystrophy genes (PSAP, TYROBP, TMEM106B, NOTCH3, TREM2, AARS2 and CSF1R).
The network is remarkable for extensive interactions with progranulin (GRN, center of network), genes implicated in immunological function (CD81, HLA-A, HLA-B and HLA-E), lysosomal genes (CTSB, CTSD, GAA, LAPTM5, LRP1, NPC2 and TPP1), genes implicated in neurodegenerative lysosomal storage disorders (CTSD, GRN, NPC2 and TPP1), and a gene implicated in familial dementia (ITM2B). The network diagram was generated using HumanBase, a publicly available online database and analytical pipeline hosted by the Flatiron Institute (http://www.simonsfoundation.org/flatiron/). We limited our search to high-quality, brain-specific relationships connected to the query genes through co-expression, protein interaction, or shared transcription factor binding. Query genes are located on the periphery of the network to facilitate visualization of their connections with interacting network genes. The thickness of a connection represents edge weight, or strength of ties. Connection color represents ‘evidence’ for an edge, defined as the posterior probability of a functional relationship given the brain-tissue specific connectivity dataset, minus the prior probability. Detailed descriptions of the techniques used are provided in Greene et al., 2015 [56] and at https://humanbase.readthedocs.io/en/latest/functional-networks.html.

