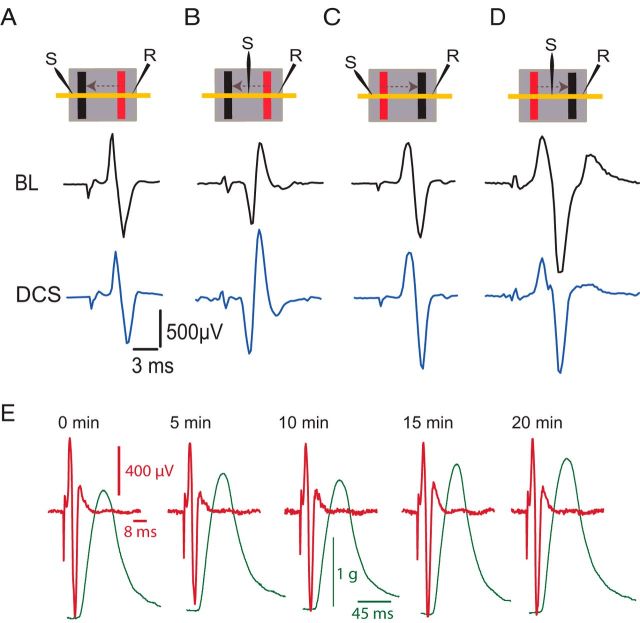
Figure 6.
Effects of DCS on local nerve excitability. A, DCS-induced changes at the nerve. Insets at the top of the figure show the arrangement of stimulating (S) and recording (R) electrodes, and DC electrodes (cathode, black; anode, red) on the sciatic nerve (yellow horizontal line). Arrows indicate the direction of current. Note that the recording electrode is located caudal to the body, and the stimulating electrode rostral to the body. The dark background represents the silicone rubber that isolates the nerve and electrodes from the rest of the body. The lower panels show traces of nerve compound action potential recorded during baseline (BL), and during spinal-to-sciatic DCS. B, Spinal-to-sciatic DCS increased nerve compound action potential evoked by test stimulation between the two DCS electrodes. C, Sciatic-to-spinal DCS increased nerve compound action potential evoked by distal test stimulation. D, Spinal-to-sciatic DCS reduced nerve compound action potential evoked by test stimulation between the two sciatic DCS electrodes. E, Examples of nerve compound action potentials (red) and concurrent muscle twitches (green) recorded after DCS (0–20 min). This shows no damaging effect of DCS protocols used in the present study.

