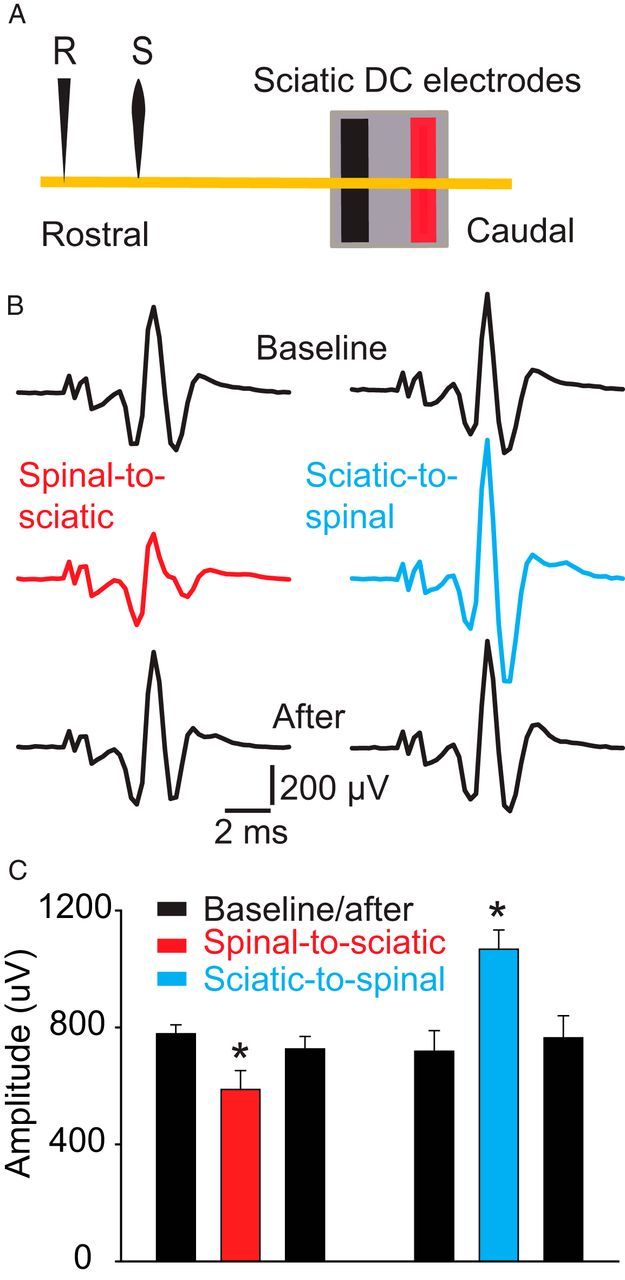
Figure 7.

Effects of DCS on the proximal segment of the sciatic nerve. A, Schematic diagram showing the experimental setup. The yellow line represents the sciatic nerve. Note that the recording electrode (R) was located ∼2 cm rostral to the sciatic nerve DC electrode. The stimulating electrode (S) was ∼7 mm caudal to the recording electrode. B, Examples of nerve compound action potentials recorded antidromically. C, Summary plot showing that the nerve compound action potential was reduced during spinal-to-sciatic DCS and increased during sciatic-to-spinal DCS. *p < 0.05. Data are shown as the mean ± SEM.
