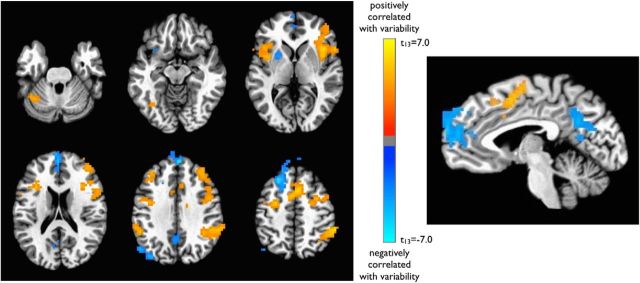
Figure 2.
Reaction time variability: VTC-BOLD signal correlation. VTC represents trial-to-trial fluctuations in response variability. Regions in blue are negatively correlated with the VTC, such that they are associated with relative stability of reaction times (lower variability; in the zone). Regions in orange are positively correlated with the VTC and thus are associated with relative instability of RTs (higher variability; out of the zone). Maps are displayed after correction for multiple comparisons (corrected p < 0.05; nominal p < 0.01, cluster size >54 voxels).

