
Figure 4.
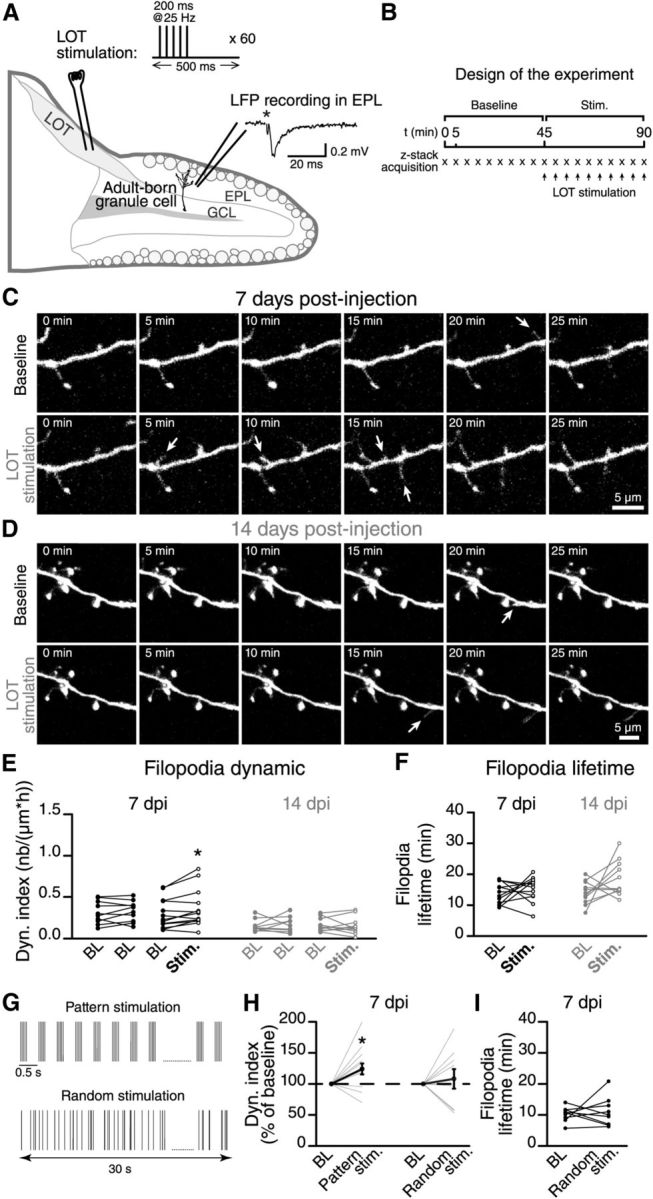
Mitral cell firing activity controls the integration of the adult-born GCs. A, A schematic drawing showing the methodology used to stimulate mitral cells in horizontal acute slices of the OB. We stimulated the mitral cell axons in the LOT using a stimulation pattern that mimicked the responses of these principal cells to odor stimuli (see inset; sixty 200 ms pulses at 25 Hz at 0.5 s intervals). The extracellular local field potential (LFP) was recorded close to the distal dendrites of adult-born GCs to ensure that the stimulation was effective. We then performed time-lapse two-photon imaging on the distal dendrites of an adult-born GC in a region with an LFP response following the LOT stimulation. B, We first recorded a 45 min BL period without stimulation. We then applied the stimulation pattern described in A at 5 min intervals (synchronized with the time-lapse acquisition). C, D, Time-lapse imaging of the distal dendrite of a 7 DPI and a 14 DPI adult-born GC before and after the stimulation. The arrows indicate the formation of filopodia. E, Summary graph showing the dynamic index for all recordings performed at 7 and 14 DPI. n = 10 cells for BL–BL and n = 13 for BL–stimulation at 7 DPI; n = 9 cells for BL–BL and n = 11 for BL-stimulation at 14 DPI. F, The stimulation of the mitral cells had no influence on the lifetime of the filopodia at 7 and 14 DPI; n = 11 cells for 7 DPI and 14 DPI. G, Comparison between the “pattern” and “random” stimulation protocols. The pattern stimulation protocol is the same as illustrated in A. Both stimulation protocols use the same number of single LOT stimulations during 30 s. H, The effect of pattern and random stimulations of mitral cells on the dynamic index of adult-born GCs at 7 DPI. The dynamic index is plotted as the percentage of the BL value. I, Quantification of filopodia lifetime; n = 13 and 9 cells for pattern and random stimulation protocols, respectively. *p < 0.05 and **p < 0.01 using a paired Student's t test.