Figure 3.
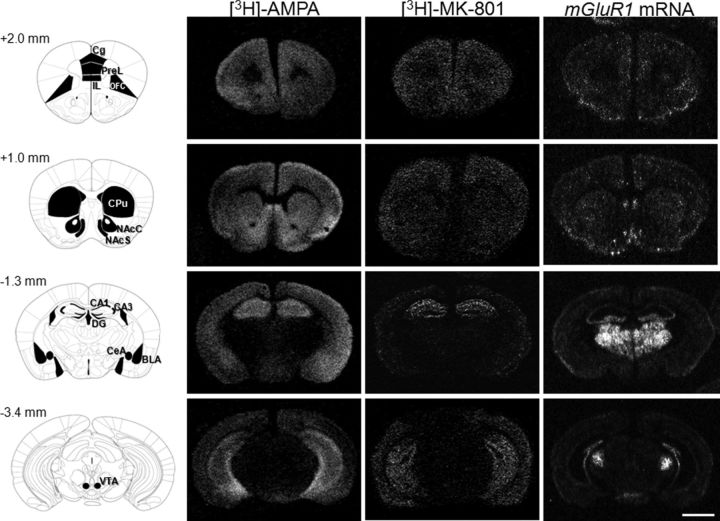
Distribution of AMPAR/NMDAR binding sites and mGluR1 mRNA in reward-related brain regions. Left, Schematic representation of the areas measured for densitometric evaluation of receptor binding sites and mRNA levels in coronal sections through the mouse forebrain at bregma +2 mm, +1 mm, −1.3 mm, and −3.4 mm according to Paxinos and Franklin (2001). Corresponding dark-field microphotographs from autoradiograms of receptor autoradiography for [3H]-AMPA and [3H]-MK-801 and in situ hybridization for mGluR1 mRNA (right) are shown under baseline condition. Scale bar, 2 mm. CPu, caudate–putamen.

