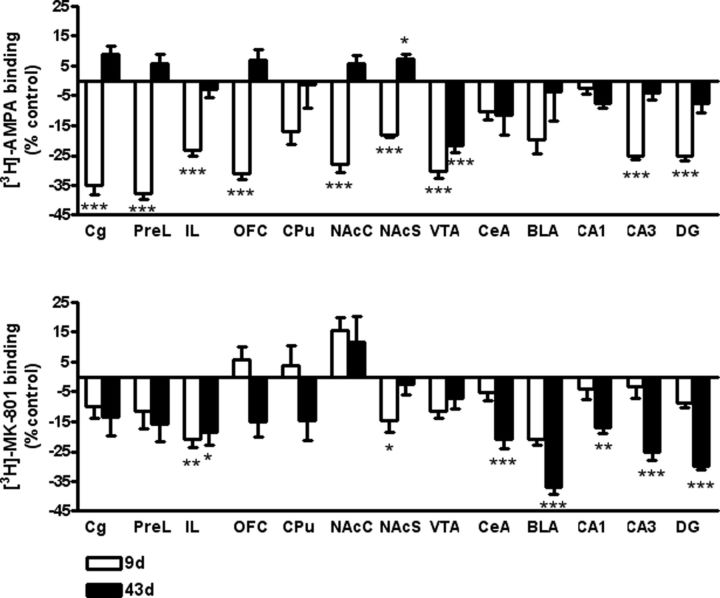
Figure 4.
Differential regulation of AMPA and NMDA expression following a single cocaine exposure. Bar graphs illustrate quantitative analysis of [3H]-AMPA (top) and [3H]-MK-801 (NMDA; bottom) binding sites in reward-related forebrain regions of C57BL/6N mice 8 d (white bar) and 42 d (black bar) after a single cocaine exposure. Data are normalized to respective saline control group (saline group: 100% = 0) and expressed as mean ± SEM. Statistical analysis is performed by regionwise two-way ANOVA followed by Fisher's PLSD test and Bonferroni's correction, n = 4–8/group, corrected p values: *p < 0.05, **p < 0.01, ***p < 0.001 versus controls. CPu, caudate–putamen.

