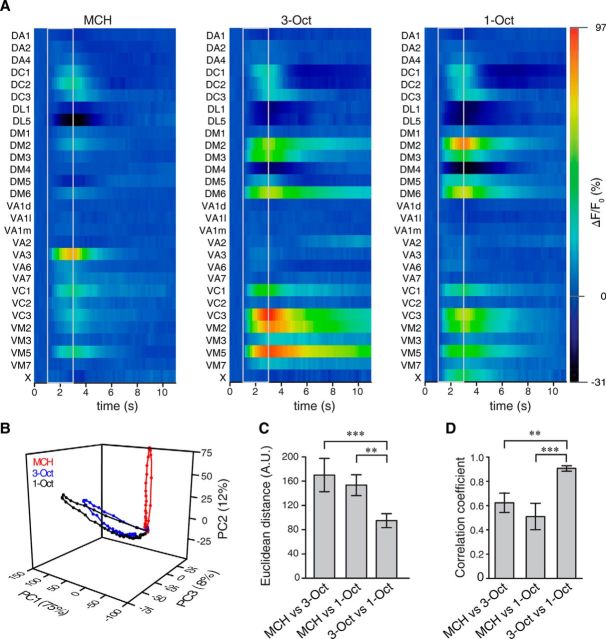
Figure 3.
Dynamics and similarity of glomerular activity patterns in sensory neurons in the antennal lobe. A, Odor-evoked changes in fluorescence emitted by the Ca2+ sensor protein GCaMP3.0 over time, shown as false colors in 29 identified glomeruli, in response to the odorants MCH, 3-Oct, and 1-Oct. Gray lines indicate odor onset and offset. Values indicate mean; n = 6 animals. B, PCA of the time courses of the mean odor-evoked responses in olfactory sensory neurons across all 29 glomeruli. The first three principal components covered >95% of the variance. C, Euclidean distances between the spatially distributed Ca2+ activity evoked by the three odorants at the time point of maximal Ca2+ change at odor offset. The Euclidean distance between the similar odors is significantly smaller than between dissimilar odors. D, Pearson's correlation between spatially distributed glomerular Ca2+ activity patterns evoked by the three odorants at the time point of maximal Ca2+ change (i.e., maximal correlation). The correlation coefficient is significantly higher between the similar odors than between the dissimilar odors. ***p < 0.001 (repeated measures one-way ANOVA with Bonferroni post hoc test). **p < 0.01 (repeated measures one-way ANOVA with Bonferroni post hoc test). n = 6. Bars indicate mean ± SEM.

