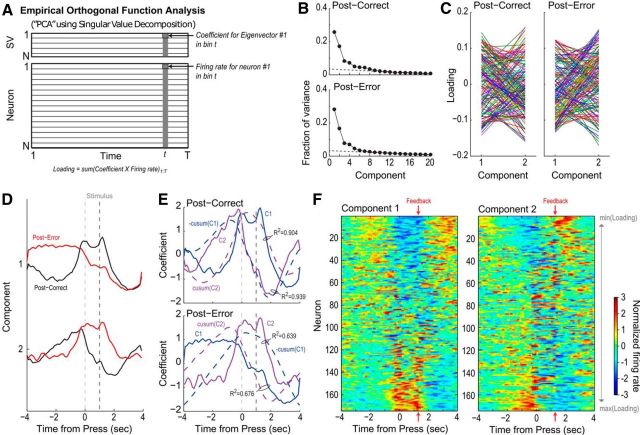
Figure 2.
A summary of the principal component analysis done in Narayanan and Laubach (2009). A, A graphical summary of principal component analysis. Normalized perievent neural data, in the form of the Z-scores of instantaneous firing rates, is organized in a matrix, with each row being the Z-scored firing rates of a single neuron on a single trial. Singular value decomposition is performed on the matrix, resulting in a matrix such that the number of columns (time bins) is the same. The rows are now ordered such that the first row contains largest eigenvector, which represents the value when the original data are projected onto the axes of highest variance. B, The fraction of variance explained by each singular value when PCA is performed on the postcorrect neural data (top), and the posterror data (bottom). In both cases, the two eigenvectors with the highest singular values account for nearly 50% of variance. The next two eigenvectors also account for an amount of variance higher than would be expected when we linearly interpolate from the smaller singular values. C, A summary of the loadings of the two top eigenvector on each neuron. If a neuron were encoding both the first and second eigenvectors to the same degree, we would expect a horizontal line. The varied lines crisscrossing each other suggest that each individual neuron has different sensitivities to the first and second principal components. D, The top two principal components for the postcorrect trials (black) and the posterror trials (red). E, Top, Plotting the cumulative sum (integral) of the first principal component closely matches the second principal component, and vice-versa (Pearson R2 = 0.904 and R2 = 0.939, respectively), in the postcorrect case. Bottom, In the posterror case, the first two principal components are no longer cumulative sums of each other (Pearson R2 = 0.639 and R2 = 0.676). This points to neural integration as a potential mechanism explaining mPFC activity. F, Normalized spike-density functions for all of the neurons analyzed in the postcorrect case, organized by the loading (left) on the first principal component, and (right) on the second principal component.

