
Figure 5.
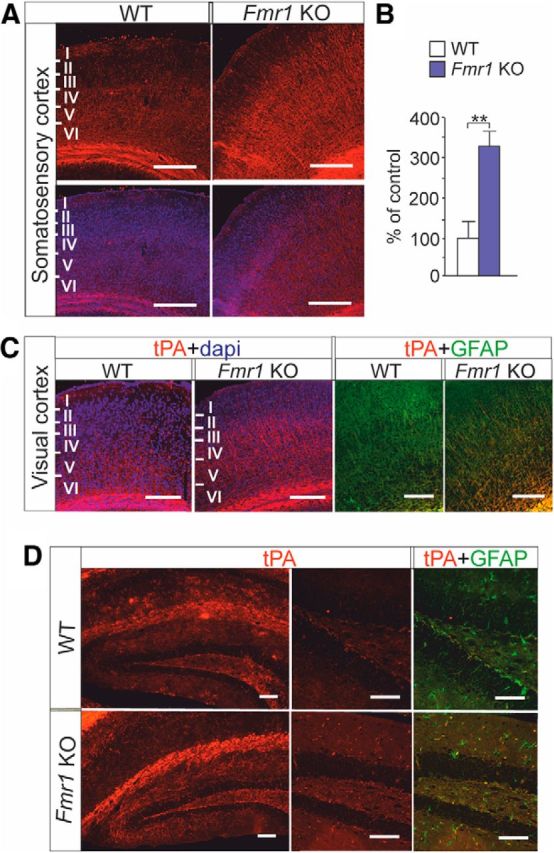
tPA expression in adult brain of Fmr1 KO mouse. A, Top, tPA immunoreactivity in red. Bottom, Merged images of tPA immunoreactivity in red and DAPI labeled nuclei in blue in the somatosensory cortex of adult wild-type (WT) and Fmr1 KO mouse. Scale bars, 200 μm. B, tPA immunoreactivity is significantly increased in the somatosensory cortex of Fmr1 KO mouse compared with that of WT controls. C, Merged images of anti-tPA immunostaining (red) combined with DAPI-labeled nuclei (blue) and anti-tPA immunostaining (red) combined with anti-GFAP (green) in sagittal brain sections from visual cortex of WT and Fmr1 KO mouse. D, tPA immunoreactivity (red) in the hippocampus. tPA expression (red) and its colocalization with GFAP (green) is shown in the dentate gyrus in a higher magnification. Scale bars, 200 μm. Data are expressed as means ± SEM. **p < 0.01, Student's t test.