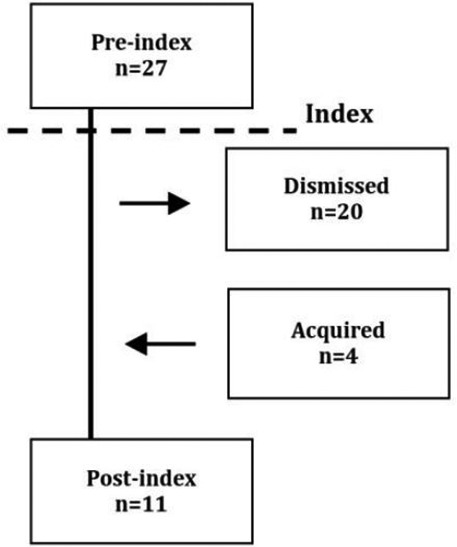
Table 2.
Analysis of epilepsy in relation to time of long QT syndrome (LQTS) diagnosis (index)
| LQTS | Controls | P value | Flow chart of LQTS patients with epilepsy |
|||
| N | % | N | % | |||
| Anytime;Epilepsy | 31 | 6.7 | 37 | 1.6 | <0.001 |  |
| Anytime;Antiepileptics | 20 | 4.3 | 23 | 1.0 | <0.001 | |
| Preindex; Epilepsy | 27 | 5.8 | 24 | 1.0 | <0.001 | |
| Preindex; Antiepileptics | 17 | 3.7 | 21 | 0.9 | <0.001 | |
| Dismissed†; Epilepsy | 20 | 4.3 | 23 | 1.0 | <0.001 | |
| Dismissed; Antiepileptics | 4 | 0.9 | 7 | 0.3 | 0.079 | |
| Acquired*; Epilepsy | 4 | 0.9 | 13 | 0.6 | 0.446 | |
| Acquired; Antiepileptics | 3 | 0.6 | 3 | 0.1 | 0.028 | |
| Postindex; Epilepsy | 11 | 2.4 | 14 | 0.6 | <0.001 | |
| Postindex; Antiepileptics | 16 | 3.5 | 17 | 0.7 | <0.001 | |
*Dismissed: only before index, not after.
†Acquired: not before index, only after.
