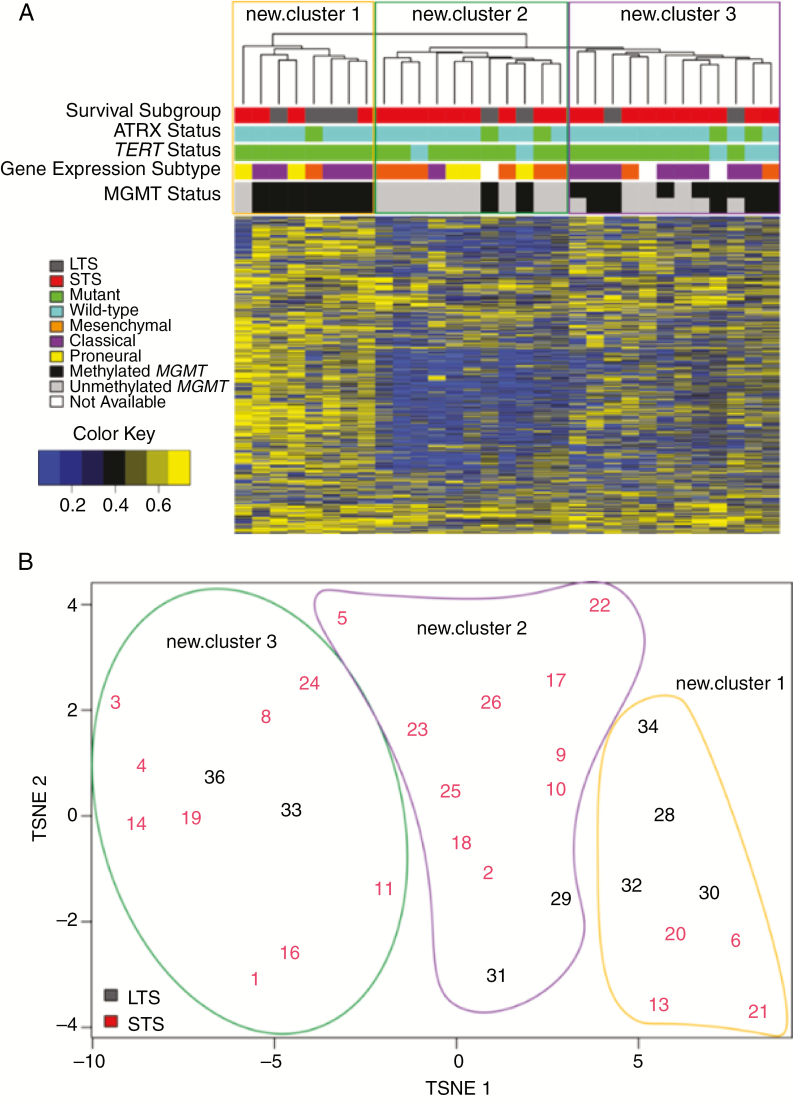
Fig. 4.
(A) Unsupervised hierarchal clustering and (B) t-distributed stochastic neighbor embedding (t-SNE) plots of top 2000 methylation probes with the highest MAD value in all IDH-wildtype GBM. MAD values were calculated for each probe across all samples. The top 2000 were selected and the complete distance method was applied. Beta values are shown in (A). Randomly assigned sample identifiers are plotted and associated by t-SNE analysis in (B).
Note: MGMT status was predicted using STP27 (top row) and UniD (bottom row) models.

