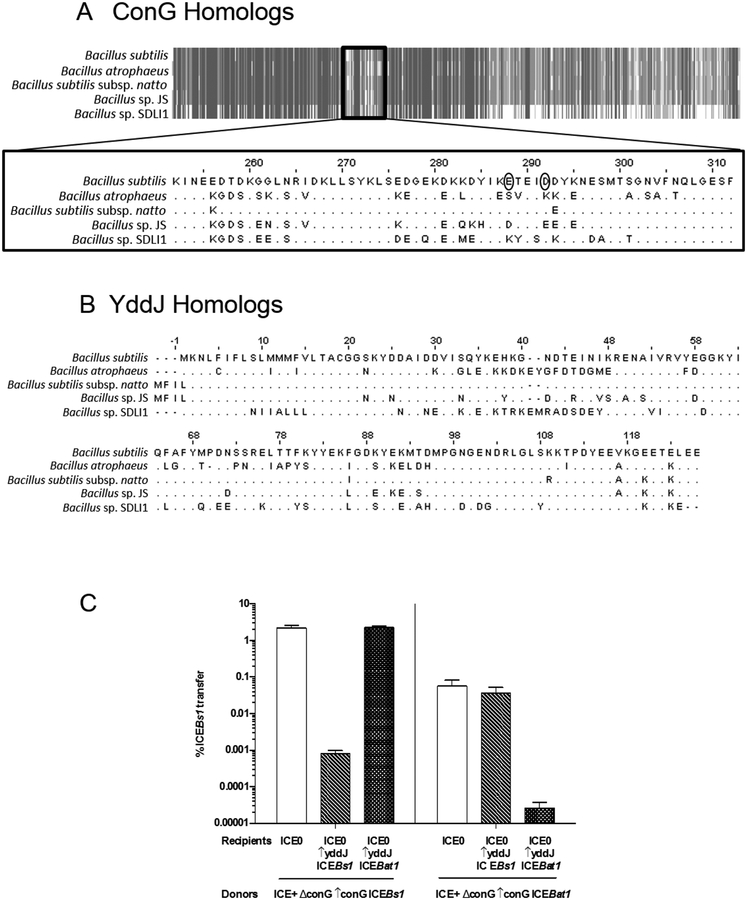
Fig. 5. ICEBs1 and ICEBat1 homology and exclusion specificity.
Alignments of ConG (A) and YddJ (B) homologs from ICEBs1-like elements from five Bacillus species, including B. subtilis (ICEBs1) and B. atrophaeus (ICEBat1), were generated using Jalview (www.jalview.org). A. Schematic alignment of ConG homologs. Gray indicates regions that are identical, while white indicates regions that are dissimilar. Alignment of the dissimilar internal region that includes the residues mutated in exclusion-resistant ConG from ICEBs1 (circled) is shown in detail. B. Alignment of YddJ homologs.
C. The percent transfer of ICEBs1 strains with conG from either ICEBs1 (left panel; donor strain KPD225) or ICEBat1 (right panel; donor strain KPD224). White bars: recipients without ICEBs1 (CAL89). Dashed bars: recipients with yddJ from ICEBs1 over-expressed (MA982). Hatched bars: recipients with yddJ from ICEBat1 over-expressed (KPD219; ICEBs10 lacA::Pspank(hy)-yddJICEBat1 str-84). Transfer was calculated as the percent number of transconjugants (KanR StrR cells) per number of initial donors. Data presented are averages from three independent experiments, with error bars depicting standard deviations.

