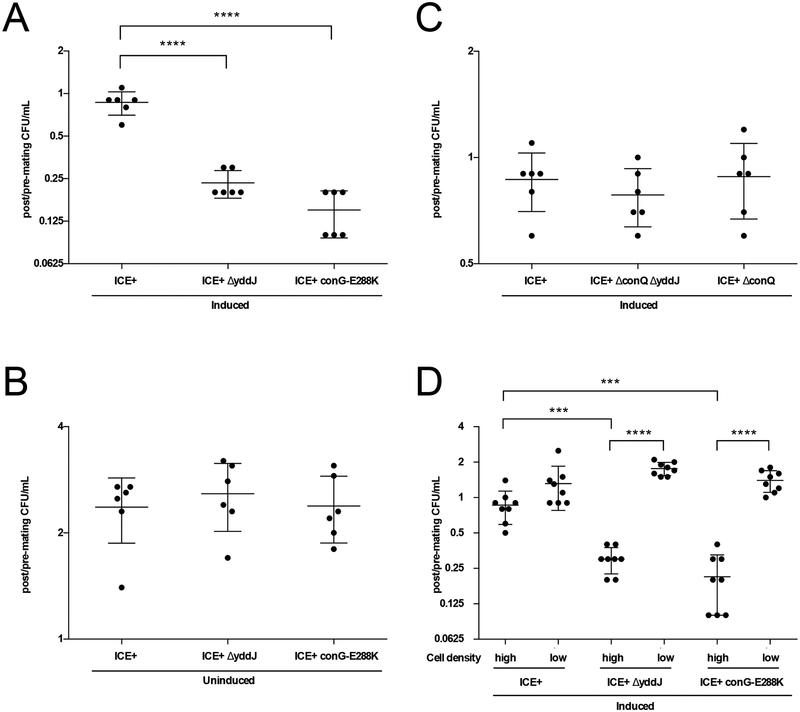
Fig. 6. Exclusion is beneficial to ICEBs1 and its host cells by preventing loss of viability due to redundant transfer.
Data depicted in A-C. are from experiments where cells (monocultures) were grown in minimal medium, induced (as indicated) with 1% xylose for 2 hours, and placed at high cell density on filters for 3 hours. Cells were sampled before and after plating on filters to determine CFU/ml pre- and post-mating conditions. The y-axis shows the number of viable cells recovered post-mating per number of input cells pre-mating on a log2 scale. Each dot represents a value from an independent experiment (n=6). The middle bars represent averages and the shorter bars depict standard deviations. P-values were calculated by an ordinary one-way ANOVA with Dunnett’s correction for multiple comparisons (**** indicates p-value <0.0001) using GraphPad Prism version 6.
A and B. Cells containing exclusion-defective ICEBs1 exhibit a loss of viability under conditions that favor conjugation. Cell recovery is shown for cells containing wildtype (MA1049; ICEBs1, Pxyl-rapI) or exclusion-deficient ICEBs1 (MA1050; ICEBs1 ΔyddJ, Pxyl-rapI, and MA1089; ICEBs1 conG-E288K, Pxyl-rapI). A. Cell viability following activation (induction) of ICEBs1. B. Cell viability with NO activation (uninduced) of ICEBs1.
C. Loss of viability from defective exclusion depends on a functional conjugation machinery. Cell recovery is shown for induced cells containing wildtype (MA1049) and transfer-deficient ICEBs1 with exclusion (MA1070; ICEBs1 ΔconQ, Pxyl-rapI) and without exclusion (MA1069; ICEBs1 ΔconQ ΔyddJ, Pxyl-rapI).
D. Loss of viability depends on high cell density. Cells containing wildtype (MA1049) and exclusion-deficient ICEBs1 (MA1050 and MA1089) were grown in minimal medium, induced with 1% xylose for 2 hours, and placed at high and low cell density on filters for 3 hours. CFU/ml were determined before and after incubation on the filter. The y-axis depicts the number of viable cells recovered from the filter per number of input cells pre-filtration on a log2 scale. Each dot represents a value from an independent experiment (n=8). The middle bars represent averages and the shorter bars depict standard deviations. P-values were calculated by an unpaired two-tailed t-test with Welch’s correction (*** indicates p-value<0.0005; **** indicates p-value <0.0001) using GraphPad Prism version 6.

