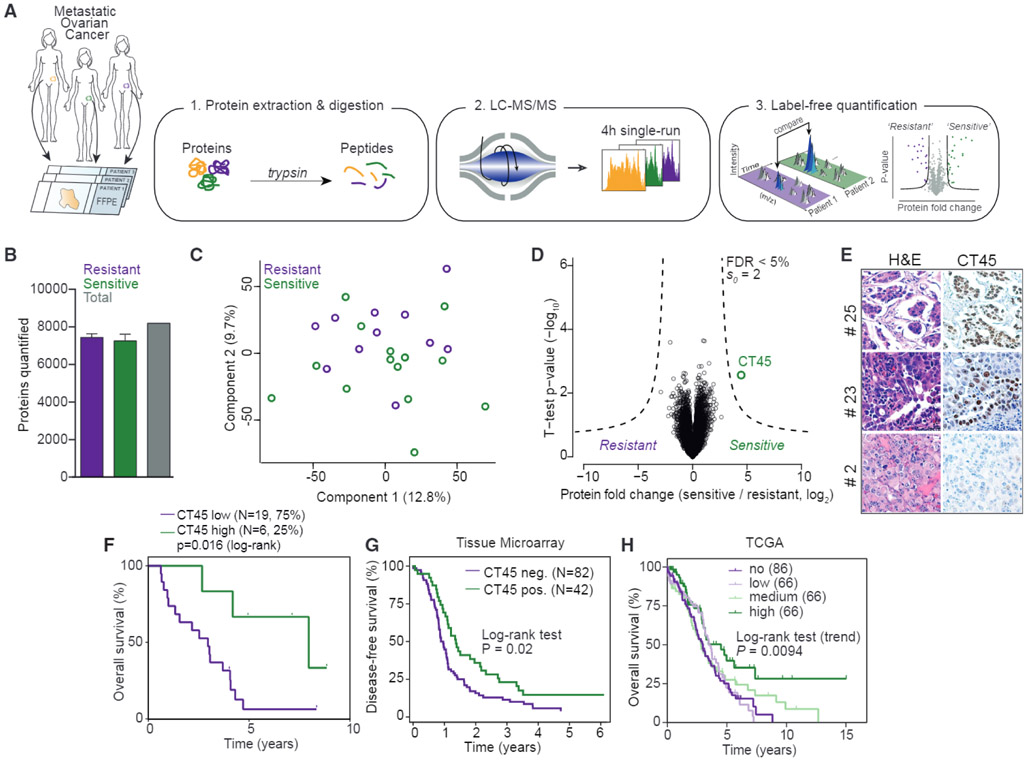
Figure 1. Proteomics Identifies CT45 Expression to Predict Long-Term Survival in HGSOC.
(A) Summary of the shotgun proteomics workflow applied to FFPE tumors from ovarian cancer patients. Following tissue lysis and homogenization, purified proteins were digested and analyzed in single-run high-performance liquid chromotography (HPLC)-MS using a quadrupole Orbitrap mass spectrometer. Data were analyzed and quantified in MaxQuant (Cox et al., 2014; Cox and Mann, 2008).
(B) Number of quantified proteins from chemotherapy-resistant (n = 11) and -sensitive (n = 14) tumors. Error bars show standard deviation for each group.
(C) Grouping of chemotherapy-resistant and -sensitive tumor proteomes by PCA. Component 1 accounts for 12.8% of total data variability and component 2 accounts for 9.7%.
(D) Volcano plot of chemotherapy-resistant versus -sensitive tumor proteomes. Expression fold changes are plotted against the t test p value (−log10). Dashed lines indicate the significance threshold (FDR < 0.05, s0 = 2). CT45 is highlighted in green. Chemoresistant patients were defined as those with less than 6 months disease-free survival from the date of last treatment to recurrence, and sensitive patients were defined as those with more than 12 months disease-free survival from the date of last treatment to recurrence.
(E) Immunohistochemistry for CT45 and corresponding H&E staining in serial tumor sections from three representative patients.
(F) Kaplan-Meier survival analysis (log-rank test) of overall survival based on CT45 protein levels in the proteomics dataset. The patients with the highest CT45 expression (top 25%, n = 6, green, median overall survival = 95.4 months) are compared to the lower 75% (n = 19, purple, median overall survival = 35.4 months).
(G) Kaplan-Meier analysis of disease-free survival based on CT45 staining of HGSOC TMAs. Advanced-stage HGSOC patients with a staining score of 0 (n = 82) versus 1+ (n = 42) are compared.
(H) Kaplan-Meier survival analysis based on CT45 RNA levels in 284 HGSOC patients from TCGA (p = 0.0094, log-rank test for trend, IlluminaHiseq BC dataset) (Cancer Genome Atlas Research Network, 2011).

