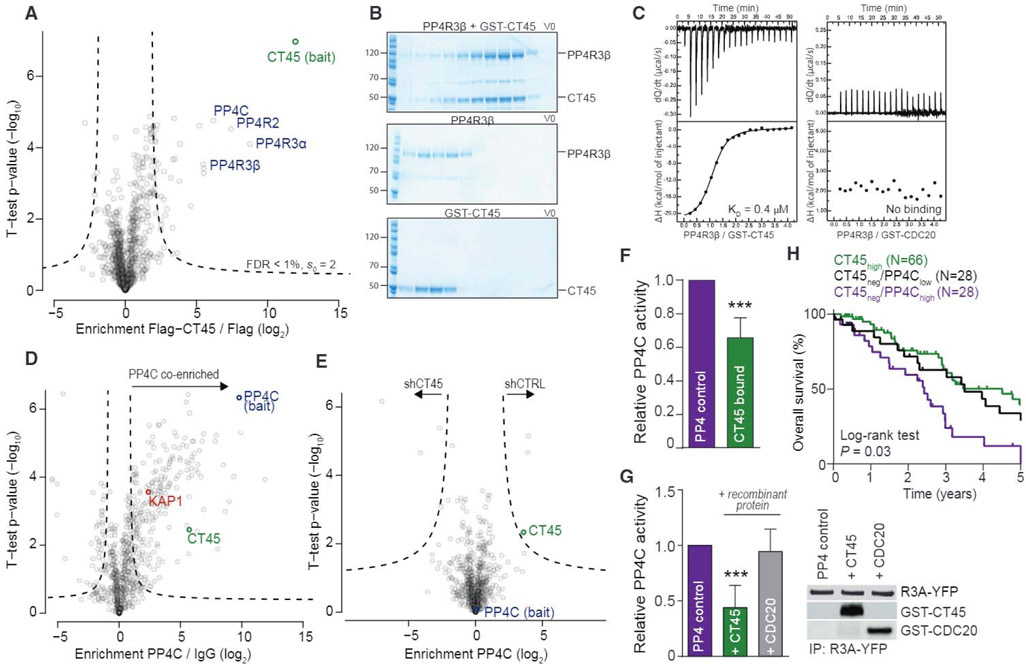
Figure 3. CT45 Is an Inhibitory PP4 Interactor Impacting on DNA Damage Signaling.
(A) Interaction proteomics screen in OVCAR-5 cells stably overexpressing FLAG-tagged CT45. Protein enrichment (t test difference) was calculated over the corresponding control cell line (FLAG tag alone) and plotted against the t test p value (−log10). Dashed lines indicate significance thresholds. The bait protein CT45 (green) and members of the PP4 complex (blue) are highlighted. Results represent three replicates per experiment group with p < 0.01.
(B) Gel filtration of recombinant PP4R3β and GST-CT45. PP4R3β and GST-CT45 were incubated for 10 min on ice and loaded onto a Superdex 200 column (top) or run individually (middle: PP4R3β, bottom: GST-CT45).
(C) ITC measurements of the binding of PP4R3β to GST-CT45 (left) or GST-CDC20 (right). Binding affinity (KD) for PP4R3β/GST-CT45 was 0.37 μM ± 0.03. No binding was observed for PP4R3β/GST-CDC20.
(D) Volcano plot of ChIP-MS results for PP4C-enriched chromatin in the 59M cell line. Fold enrichment (log2) of PP4C versus immunoglobulin G (IgG) control is plotted against the t test p value (−log10). Dashed lines indicate significance thresholds (FDR < 0.05, s0 = 1). The bait protein PP4C is highlighted in blue, CT45 is in green, and the known PP4 interactor and substrate, KAP1, is in red.
(E) Volcano plot of ChIP-MS results for PP4C-enriched chromatin in stable CT45 knockdown 59M cells. Fold enrichment (log2) of the PP4C interactome in shCT45 versus shCTRL cells is plotted against the t test p value (−log10). Dashed lines indicate significance thresholds (FDR < 0.05, s0 = 1). The bait protein PP4C is highlighted in blue, and CT45 is in green.
(F) Phosphatase activity assay of the immunopurified PP4 complex in OVCAR-5 cells expressing a control vector or CT45. Quantification results represent the average of five independent experiments with t test p < 0.001. Error bars show standard deviation for each group.
(G) Phosphatase activity assay of the immunopurified PP4 complex in the presence or absence of 3 μM recombinant GST-CT45 or GST-CDC20 control protein. Quantification results (left) represent the average of five independent experiments with t test p < 0.001. Western blot (right) is shown as loading control.
(H) Kaplan-Meier survival analysis based on PP4C mRNA levels in the CT45 negative patient group of Figure 1H. Low PP4C levels in the tumor (lowest 33%, n = 28, black line) predicted significantly increased overall survival (p = 0.03) as compared to high PP4C levels (top 33%, n = 28, purple line). Patients with high CT45 expression (green line) are plotted for relative comparison.
See also Figures S2 and S3.

