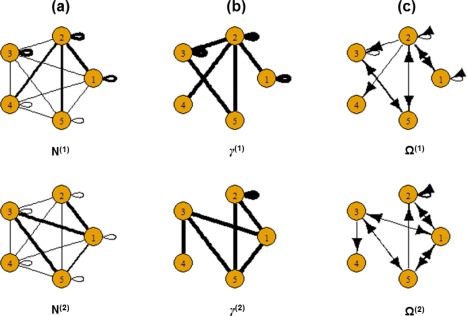
Figure 2.

Simulated data: (a) Simulated group‐level structural connectivity, (b) Simulated non‐zero group‐level effective connectivity, (c) Simulated values of group‐level effective connectivity. The thickness of the edges is proportional to magnitude. [Color figure can be viewed at http://wileyonlinelibrary.com]
