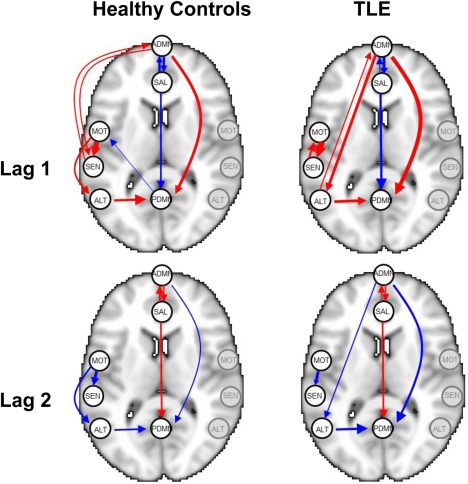
Figure 13.

Temporal lobe epilepsy dataset: Estimated group‐level effective connectivity between resting‐state networks, using a Bayesian FDR control of 5%, for a prior sparsity of 0.01. Edge widths are proportional to the magnitude of the estimated VAR coefficients, with red edges denoting positive values and blue edges denoting negative values. Nodes in the graph are overlaid for representative purposes as point landmarks on half of a standard Montreal Neurological Institute (MNI) template brain and not indicative of the entire network. For simplicity, self‐connections are not shown. [Color figure can be viewed at http://wileyonlinelibrary.com]
