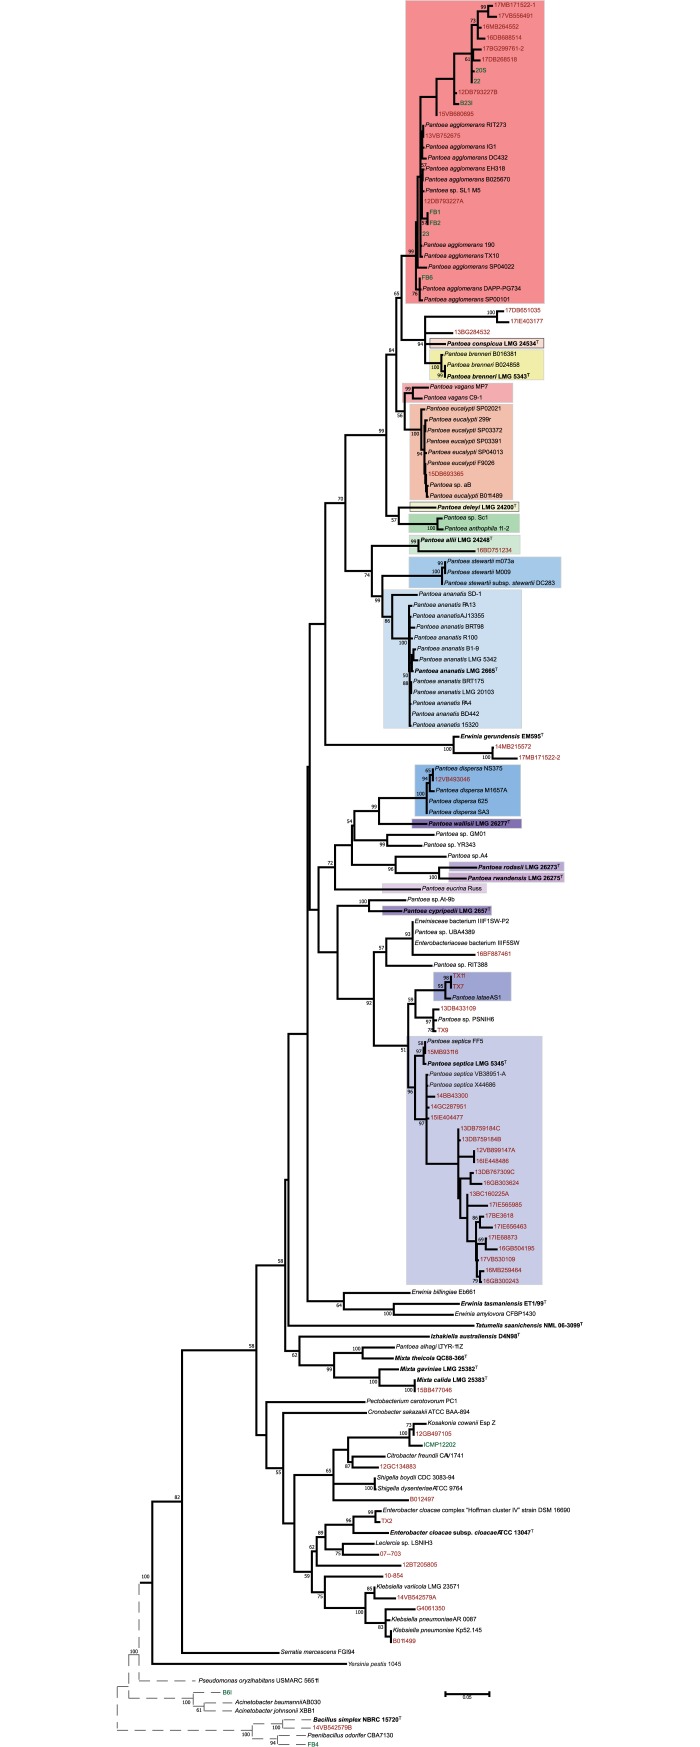
Fig 2. Phylogeny of clinical isolates and reference strains generated using cpn60 sequences.
The phylogeny was generated using maximum likelihood with the general time reversible model. Nodes represent the result of 1000 bootstrap replicates, with values ≥ 50% shown. Colored boxes indicate established Pantoea species groups. Outgroups beyond Enterobacteriales are denoted by dotted-line branches and are not to scale. Type strains are denoted by bold font and superscript "T". Clinical strains analyzed in this study are shown in red font while environmental strains are shown in green font.

