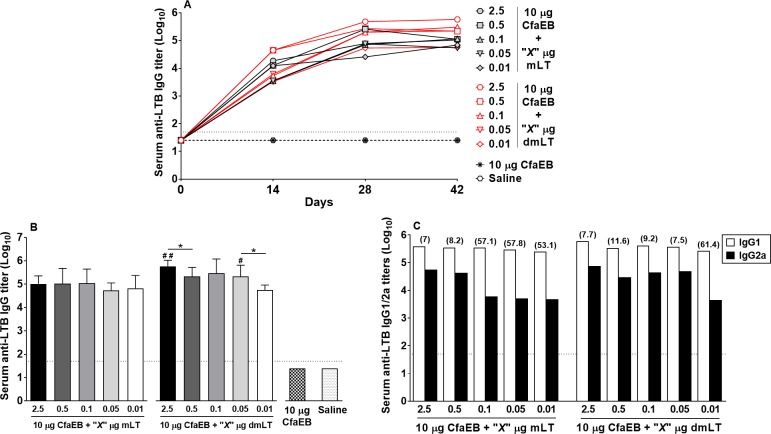
Fig 6. Serum anti-LTB IgG titers.
(A) Kinetics of anti-LTB IgG Ab titers on d0 (evaluated with pool of 7 animals/group), d14 (evaluated with pool of 7 animals/group), d28 (evaluated with pool of 7 animals/group), and d42 (evaluated in individual sera, 5 animals/group); (B) Mean geometric log10 transformed anti-LTB Ab IgG titers on d42 for all groups; (C) Anti-LTB IgG1 and IgG2a Ab titers on d42 performed with pooled sera (bars represent the mean of duplicate assays); IgG1/IgG2a ratios are shown in parentheses. Dotted horizontal line represents the limit of detection for the assay. *P<0.05, **P<0.01, and ***P<0.001 indicated for statistical comparisons performed within mLT or dmLT groups; #P<0.05, # #P<0.01, and # # #P<0.001 indicated for statistical comparisons performed between the same dose of mLT and dmLT.

