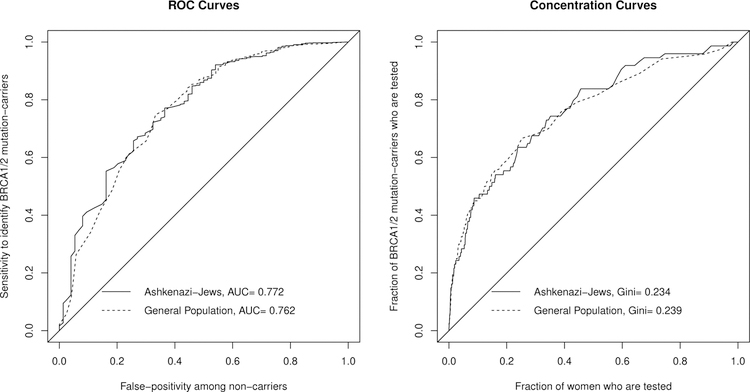
Figure 2:
ROC curves (left plot) and Concentration (Lorenz) curves (right plot) for the BRCAPRO risk model to predict if a woman carries a BRCA1/2 mutation, for Ashkenazi-Jews and the general population. Note the curves are similar between populations, even though mutation prevalence is 10-times higher among Ashkenazi-Jews.

