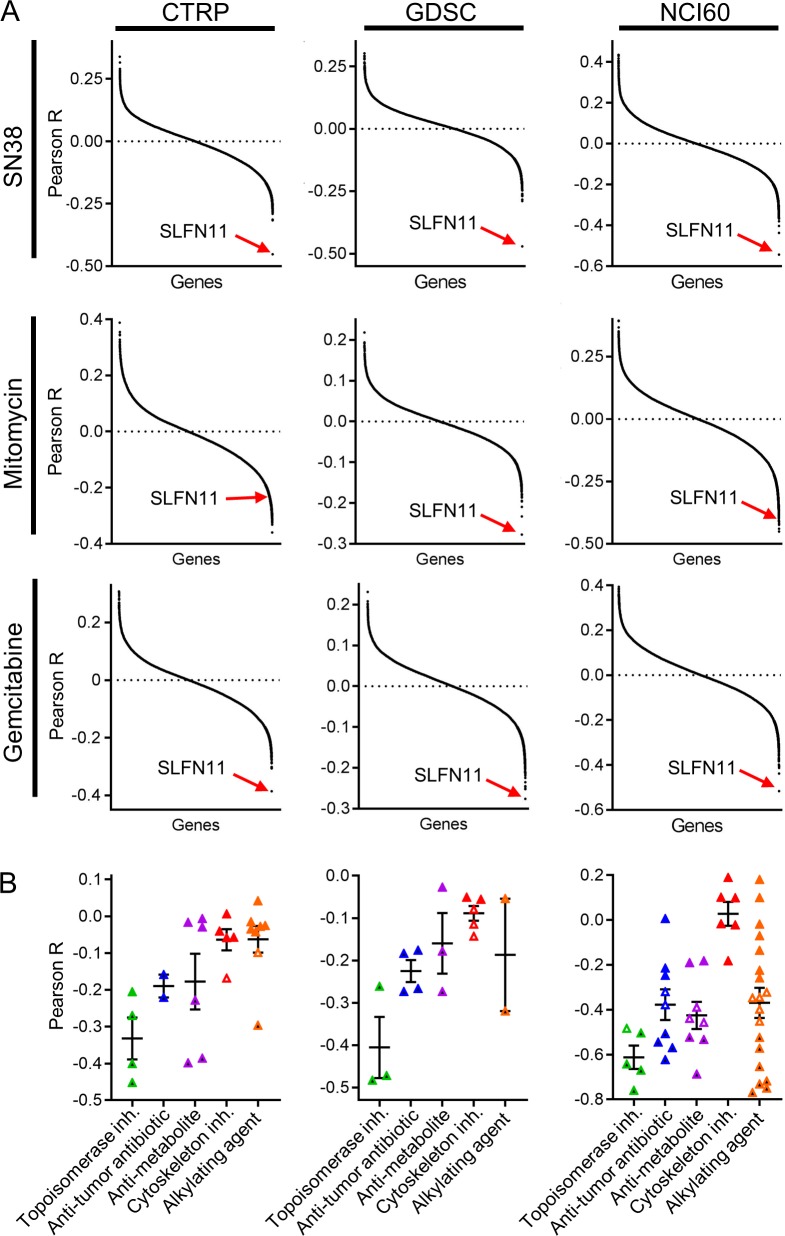
Fig 1. SLFN11 mRNA levels are strongly correlated with sensitivity to chemotherapeutics in cancer cells.
A) mRNA levels for each gene were compared with drug sensitivity to a panel of chemotherapeutics across the CTRP (IC50), GDSC (AUC), and NCI60 (IC50) datasets. Pearson correlation values were plotted for each gene for SN38, mitomycin, and gemcitabine as representative chemotherapeutics. B) SLFN11 mRNA levels were compared with drug sensitivity as in (A) by Pearson correlation. Each point represents the IC50 of a given drug. Horizontal lines indicate mean ± SEM for each drug class. Black filled, white-filled, and color-filled symbols indicate p≤0.001, p≤0.05, and p>0.05, respectively.

