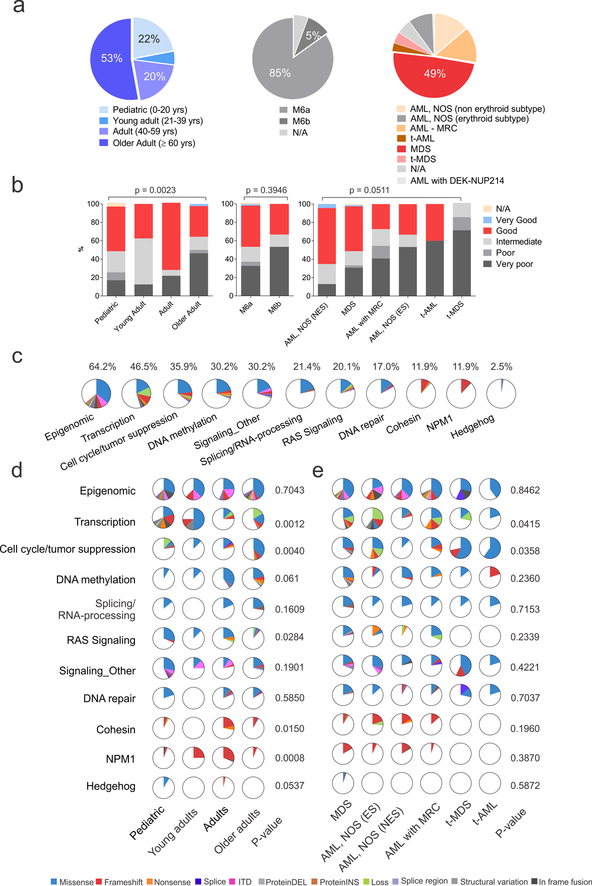
Figure 1. Demographic, clinical and genomic patient’s characteristics.
(a) Distribution of patients according to age (left), WHO 2008 criteria (middle) and revised WHO 2016 criteria. (b) Revised International Prognostic Scoring System (IPSS-R)-based cytogenetic risk according to age (left panel), WHO 2008 (middle) and WHO 2016 (right panel) criteria (n= 159 biologically independent samples). Two-sided P values are from exact-Chi-square test (age and WHO 2008) and Chi-square test (WHO 2016) (c) Pie charts showing the distribution of the recurrently mutated pathways in the whole AEL cohort. (d) Pie charts showing the distribution of the recurrently mutated pathways according to age (n= 159 biologically independent samples) and WHO 2016 criteria (e) (n= 149 biologically independent samples). The similarity of somatic alteration prevalence in different leukemia subtypes was evaluated by two-sided Chi-Square test. See also Supplementary Tables 8 for numbers and P values for each pathway and gene. Abbreviations: yrs, years; N/A, information not available; ns, not significant; AML, NOS acute myeloid leukemia, not otherwise specified; NES, non erythroid subtype; ES, erythroid subtype; t-AML, therapy-related AML; t-MDS, therapy-related MDS.

