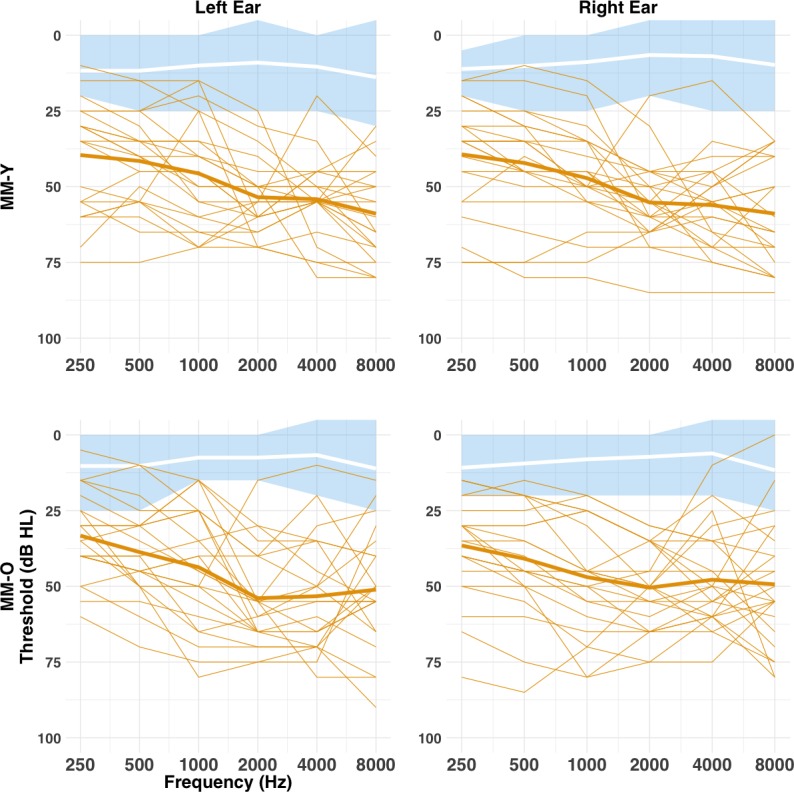
Figure 1. Pure-tone air-conduction audiometric thresholds (cross-sectional study).

Audiometric thresholds are shown across octave frequencies from 0.25 to 8 kHz for the MM (orange) and NH (blue and white) groups, Y (top row) and O (bottom row) age bands, and left (left column) and right (right column) ears. Individual thresholds for the MM group are shown as normal lines, and the group mean marked by a bold line. Mean thresholds for the NH group are marked by a white bold line, with the shaded blue area representing the range for the NH group. There was no difference between the MM-Y or MM-O subgroups in audiometric thresholds (all p>0.05; see text).
