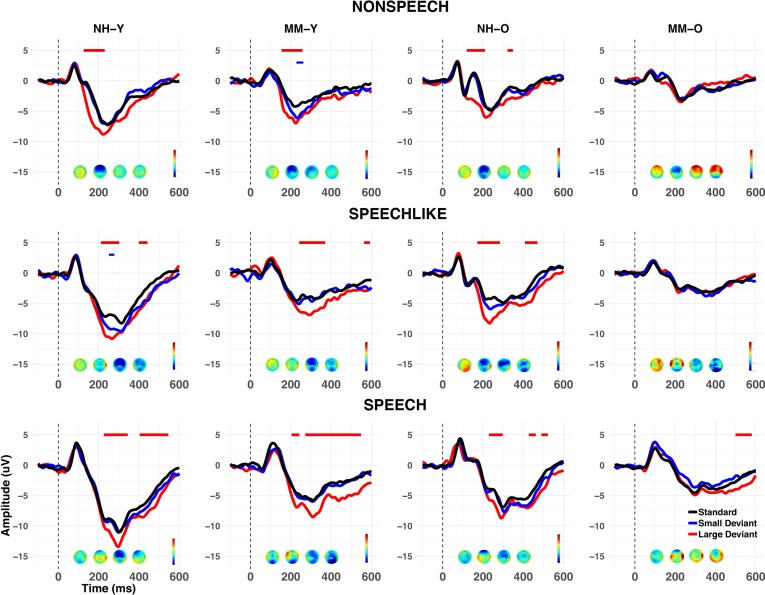
Figure 3. Grand average waveforms at Cz (cross-sectional study).
Grand averages are shown for each group (NH vs. MM), age band (Y vs. O), and condition (nonspeech, speech-like, speech). Responses to standards are shown in black, and to large and small deviants in red and blue respectively. Voltage maps show the mean MMN activity during the 100–400 ms post-stimulus time window. Negative values of the MMN are shown in blue, and positive values in red. Periods of the 100–400 ms (MMN) and 400–600 ms (LDN) post-stimulus epoch where a significant (p<0.01 for>20 ms consecutively) MMR was observed in the grand average are shown by horizontal lines above the waveforms, as a function of deviant type. Note that whilst both the Y and O NH subgroups (NH-Y and NH-O), and the MM-Y subgroup obtained significant MMNs for large deviants across all conditions, the MM-O subgroup failed to show a significant MMN to any stimulus type in any condition (see text for details).

